
In this article, we are going to take a look at a tool usually used in the analysis and control of risk, the Probability Impact Matrix.
The Probability Impact Matrix is a simple tool that utilizes a combination of impact and probability variables to help in both categorizing and determining the priority of specific risks.
During the article, we will look at
- What the Impact Matrix is
- How to use it
- Some examples
- What is good about it
- Some things to watch out for
Why you need need a Qualitative and Quantitive Assesment of Risk
Your company, like many others, will no doubt undertake a variety of projects. Many of these are likely to be complex. Risk management within these (and all) projects, requires careful consideration and effort with a key focus on being able to assess and prioritize risks, so they receive an appropriate level of attention.
Most projects find themselves faced with a variety of risks that must be balanced against the resources available. For example, there may be little reason to spend significant time managing a risk that has only a small likelihood of turning into an issue especially if it only has trivial levels of impact. Time would be better spent managing those risks that would cause more significant concern.
Therefore there is a need to both assess AND prioritize risk. Quantitative risk analysis is essential in safeguarding your projects and ensuring that they are delivered successfully.
The Probability Impact Matrix is a tool that can help you do that.
What is a Probability Impact Matrix
As we stated in our introduction, the Probability Impact Matrix is a tool that helps in the process of quantifying levels of risk.
The traditional Risk Management process follows various steps, such as:
- Risk Identification
- Risk Analysis
- Risk Evaluation
- Management of the Risk
- Risk Monitoring
The Probability Impact Matrix assists with steps 2 & 3 of this process.
It offers several benefits, such as:
- It’s simple and straightforward
- It provides a standard, repeatable process
- It provides a universal method used in various businesses and industries.
- It can be tailored to your specific business (where you specify specific groups for risk).
The matrix is based on a simple grid system. You can see two probability impact matrix examples below.
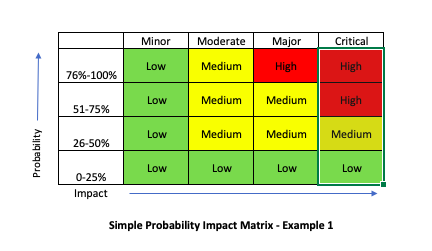
The second example below – shows axis that go from 1-10 for both Impact & Probability giving the user improved definition over example 1.
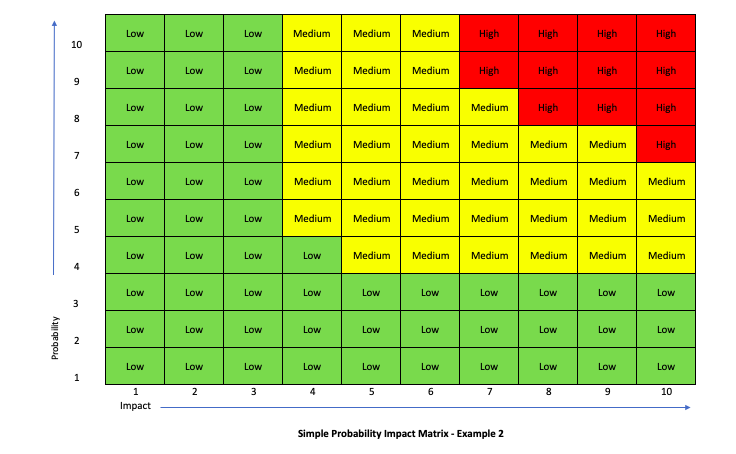
As you can see the matrix is fairly straightforward to create and you can easily build one using Excel.
The matrix assumes that risk is driven by two aspects:
1. Probability
Probability refers to the likelihood of a risk transpiring.
2. Impact
The impact of risk refers to what happens when it is realized (when it turns from a risk into an issue). The size of the impact can vary on several facets (including elements like Cost and Time for example).
The tool utilizes a range for each usually either in numerical terms (e.g. 0-10), or in percentage terms.
While there is a standard structure to the Impact matrix, if you take a look around google for some examples, you’ll see the finished result can vary depending on the business or industry you find yourself in. Different industries/businesses may group low, moderate and high differently to you.
This is by and large due to the weighting of the risk. Often this is driven by varying assessment criteria or prioritization methods. However, these are all variations on a theme; the core of the tool remains the same.
The matrix typically has several sections defined by the scores of probability and Impact they are:
- Low – typically a combination of low impact with low to medium probability
- Medium – generally moderate impact and a moderate probability
- High – usually high impact and high probability.
Note these segmentations are subjective and are usually set by the business executing the risk assessment.
When the Impact and Probability are analyzed, the result is one of several scenarios, which may result in different actions:
1/ Low impact / Low probability
These risks are characterized by low levels of risk and are often disregarded.
2/ Low impact/ High Probability
These risks are likely to turn into issues but have a low enough impact that they can be managed. Note: Managing them may prove challenging, depending on the quantity of them.
3/ High impact / Low Probability
These risks have a high impact but are unlikely to turn into Issues. These can be managed by proactively taking actions to reduce either probability or impact.
4/ High Impact / High probability
These are risks that have a significant impact on your project if they are realized and have a high likelihood of occurring. These are the ones that your resources should be focused on managing.
How to use a Probability Impact Matrix
The tool is relatively simple, and you can utilize it by following these steps:
1/ Brainstorm and list out your risks that you’re likely to encounter with your project.
2/ Assess each risk utilizing the variables of impact and probability.
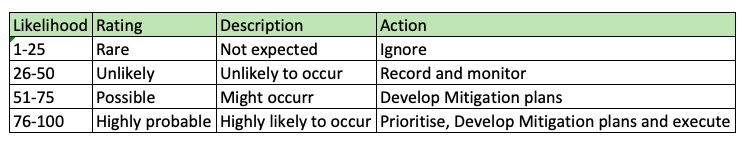
One of the issues here is that different individuals might not grade risks the same. To compensate, you can utilize a guide such as shown below that describes how risks should be scored. This guide could also be used for other attributes i.e to include further instructions advising on mitigation steps:
3/ Map out the ratings for each risk on the matrix.
4/ Develop an action plan for each risk.
Example Probability Impact matrix
Let’s take a look at an example of using the matrix.
We’ve identified five risks for our project and have scored their impact and probability as shown on the table below.
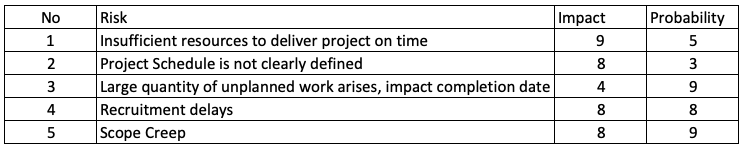
We’ve now placed them on the Probability Impact Matrix which you can see below.
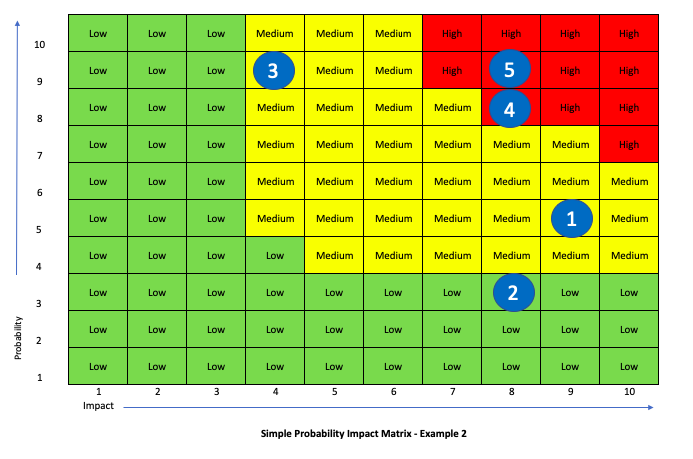
You can see that Risks 4 & 5 are our priority, and we need to ensure we focus efforts on developing appropriate mitigation plans for these.
As you can see, the matrix is simple to use and offers a structured methodology for making assessments of risk.
Positives and Negatives of using the Probability Impact Matrix
Benefits
There’s several positive attributes about integrating the matrix into your process:
- It’s simple to use and easily repeatable
- It provides a qualitative and quantitive assessment of risk
- It allows you to categorize your risks easily
- It will enable you to visualize your risks (which is excellent when you want to communicate them out to a wider audience).
Some things to watch out for
As with all tools, the impact matrix is not a panacea, and there are a few things to watch out for:
- It is only an assessment tool, and you still need to contingency plan
- It does not replace your risk process, and you still need to capture and manage your risks accurately.
- Different individuals may score risks differently (look to utilize some form of rating system/score guide, so all risks are graded equally)
Summary
We hope you enjoyed our article on the Probability Impact Matrix.
We hope you agree with us that it’s a simple tool that should be utilized within your risk management process.
What do you think of the tool? Perhaps you’ve tried this in your own business? We’d love some feedback, feel free to use our comments section below or message us on Twitter – we’d love to hear from you.