Good old excel never ceases to show me new things!
If like me you work in engineering you’ll be familiar with the fact that design drawings get updated. If like me you often have analyze the impact of those changes then until recently I’ve always looked to do this manually as my design drawings release/version are alphabetically based.
I.e. Drawing for part 123 is released at A, after 4 release updates you’re at issue E, now I’ve always looked to calculate these manually but recently I uncovered the fact that good old Excel can do this for you! Great eh?
So how to do it?

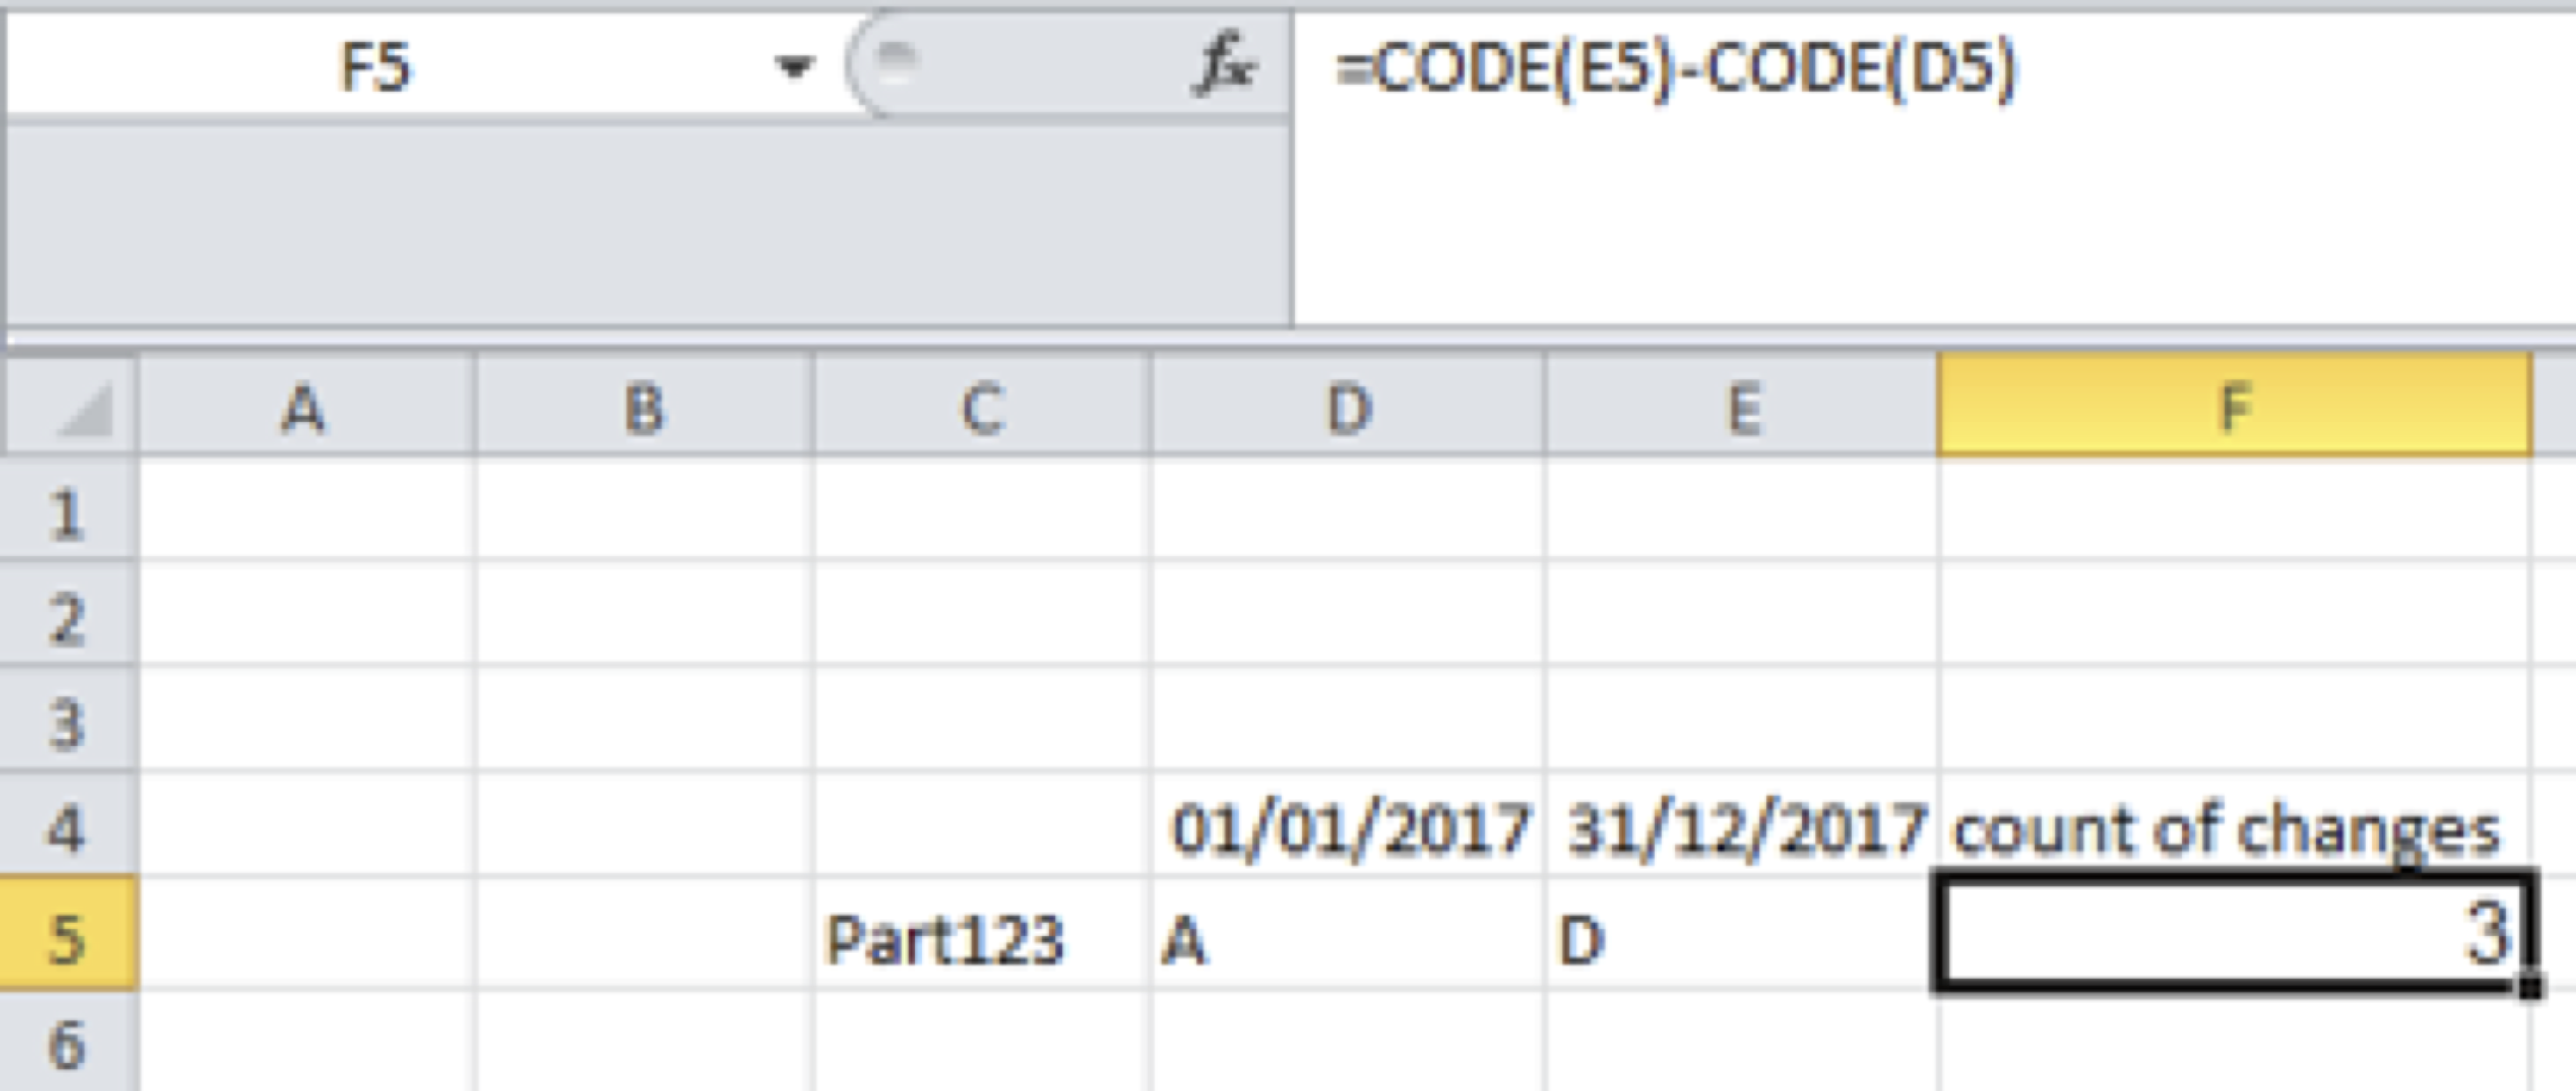
In the screen shot above I’ve listed the part I’m analyzing, I’ve shown the drawing release as was on the 1/1/2017 at “A” and 31/12/2017 at “D”. I’ve then added a column called count of changes in this cell I’ve used the following formulae
=CODE(E5)-CODE(D5)
E5 contains the “D” and D5 contains the “A”. Excel then calculates the result of 3.
Now there are some things it can’t handle (or I haven’t found how to yet). Minor increments i.e. A to Aa cannot be calculated and both characters need to be the same case (i.e both upper or both lower). But other than that it works like a charm.
Hope you find the above useful and give it a try.