In our recent article on the RACI matrix, we covered the tool, how it’s used and it’s pro’s and con’s. If you’ve not caught up with what the article, you can read up on the RACI Matrix explained by clicking the link.
In this article, we’ll review how you can create a simple RACI matrix template in Excel.
The good news is that the model is fairly easy to create, all you need to have is some basic formatting skills.
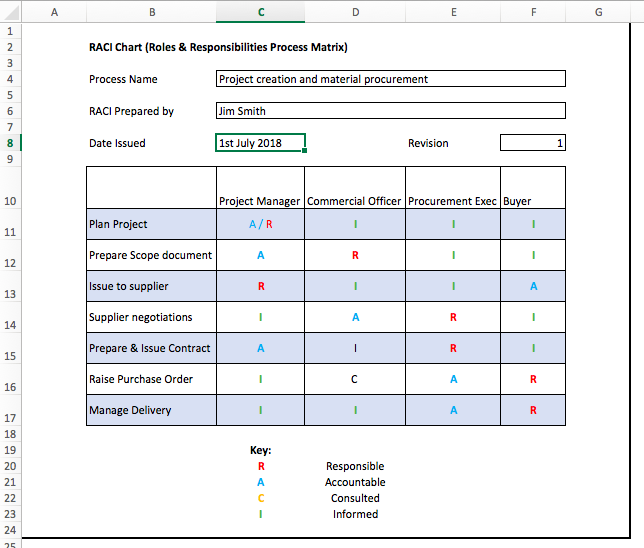
Here’s the RACI Matrix template that I put together.

Let’s have a look at the steps I used in creating the template.
In my RACI matrix I’ve divided the process map into 2 sections
1/ Header Infomation / Revision History
2/ Process steps
1/ Header Infomation / Revision History
I always think it’s best practice to start with information about the process being captured, the author, the date of publication. This is important stuff as it helps the user understand how up to date it is and who to speak to if there are issues with the process as described.
a/ In Cell B2 – I record the fact that this is a RACI Chart (Roles & Responsibilities Process Matrix). This informs the user what they are looking at
b/ Cell B4 – I enter the Title “process name” –
I then Merge C4:F4, place a solid border around it, and use that to record the process name – in the case of the example this is “Project creation and material procurement”)
c/ Cell B6: I enter the title “RACI Prepared by:”
Again I merge C6:F6, place a solid border around it, and use this to record the process map author.
d/ Cell B8: I enter the title: “Date Issued:”
In C8 I place a solid border around the cell and use it to capture the date the process map was issued.
In Cell E8: I enter the title, Revision.
In Cell F8, I place a solid border around it and use it to record the revision status of the process map.
2/ Process Map
I create simple table placing the participants along the top and the process steps down the left hand side.
Cell B:10 I leave blank
Cell C:10 to F10 I enter the Job Titles participating in the process. Note you could use names here if you prefer.
Underneath the tables I enter a row for each process step, I’ve found it useful to differentiate each step with a different fill color – in the example, I’ve opted for alternate blue/white.
In Column B I capture the process step and then I use the RACI key to capture which category is used for each of the job roles captured in my header. I’ve used different colors for each category as I think it helps them stand out.
In my process, I’ve got 7 steps but of course, your process may have less or more but you can follow the basic principle.
Under the process map (in this case from Cells D20:D23 I’ve added a key so that the user of the process map understands the categories used.
I’ve then placed a solid border around the process map.
So there you have it, a quick and simple RACI matrix template in Excel.
Hope you have some fun creating your own RACI template. We’d love to hear your feedback in the comments section below.
This post is part of our Management & Leadership Guide.