
Let’s face it, with all the pressures we face whether that’s in our work or home life, managing our time can be hard. The very task of prioritising, organizing, planning your time around your goals and activities can seem a mountain to climb.
However, if we don’t have a system then two things can happen
1/ We end up becoming reactionary to the job that shouts the loudest, the latest email to arrive in our inbox or the colleague that comes to our desk wanting help.
2/ We end up getting distracted by things that we shouldn’t be doing in favour of things we should (i.e. just 10 more minutes of Youtube/Instagram – honest!!)
The result of this are that we don’t achieve our goals.
Sometimes, we need a helping hand. That’s where time management tools fit in.
An effective time management strategy
Which of these do you think is best practice?
a) We’ll use our emails to drive our activities working from the latest ones that arrive. We’ll let others dictate what we should do (whether or not it meets our own personal goals) and allow ourselves to waste time on things that don’t enhance our lives.
b) We’ll have an active (and prioritised) to do list. We’ll divide our day into segments that focus on the key things that we need to get done. We’ll focus our activities around key tasks. We will not allow ourselves to be distracted and will spend our time doing things that enhance our lives.
Ok so obviously answer (b) will add more to our lives? But how do we do that?
We use tools, and that’s where the time management chart comes in.
In this article we’re going to show you how to build your own Time Management Chart together with a time management worksheet that will help populate it.
There are a couple of formats you can use for time management charts and we’ll give you two examples!!
We’re going to create our Time Management Chart using Excel (if you’re just after the table itself (which you can write down your data)- you can download the PDF here)
Let’s get to it!!
1/ Time management chart using days
Ok so the first things we’re going to do is to create the table to store our data.
Here’s our example below:
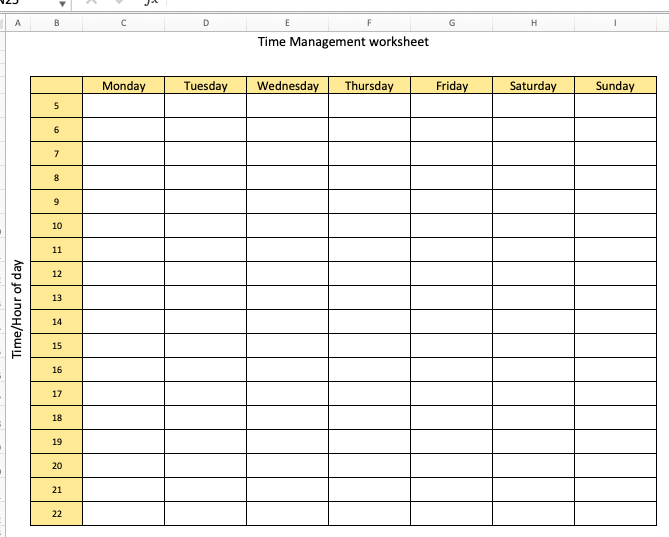
This is fairly simple, down the left we’re going to enter the hours that we’re tracking (in our example 5am through to 22:00 hrs.)
Across the top we’re going to enter the days we’re tracking – we’re going to put the full 7 days here (although you could go Monday to Friday if you’re just tracking your work-life).
We’ve formatted it with some simple gridlines and color.
Now we’re going to create our categories and place them to the right of our table
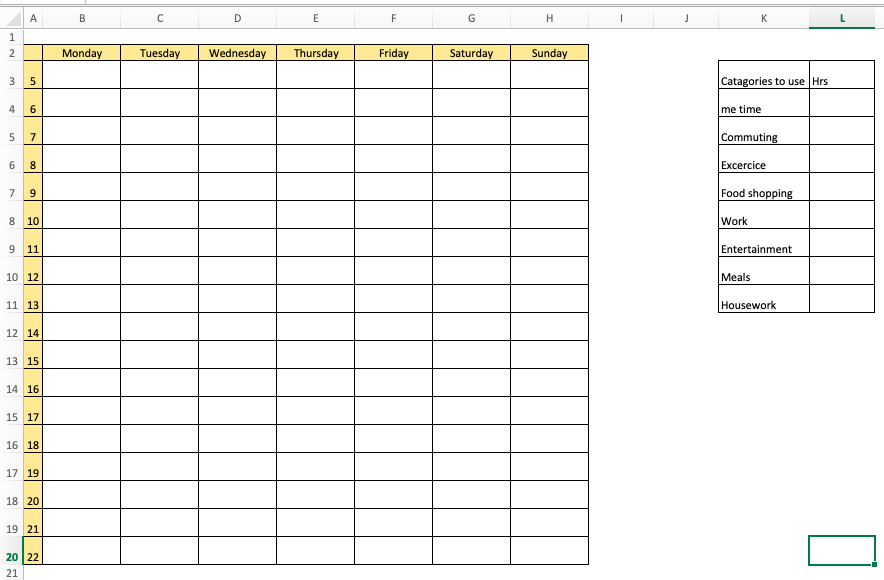
For this we’ve chosen:
- Me time
- Commuting
- Excercice
- Food shopping
- Work
- Entertainment
- Meals
- Housework
We then enter these into our table (you can see the completed table below).
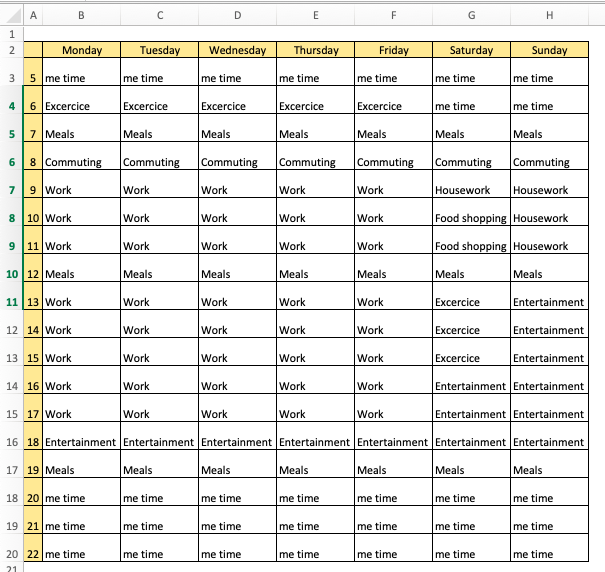
Note that we have to enter these precisely – i.e. no spelling mistakes!!
Ok so the next thing we’ll need to do is to calculate how much time we spend against each of these catagories.
Using our category table we created earlier, we’re going use a simple formulae to count the number of occurrences of the title in our table.
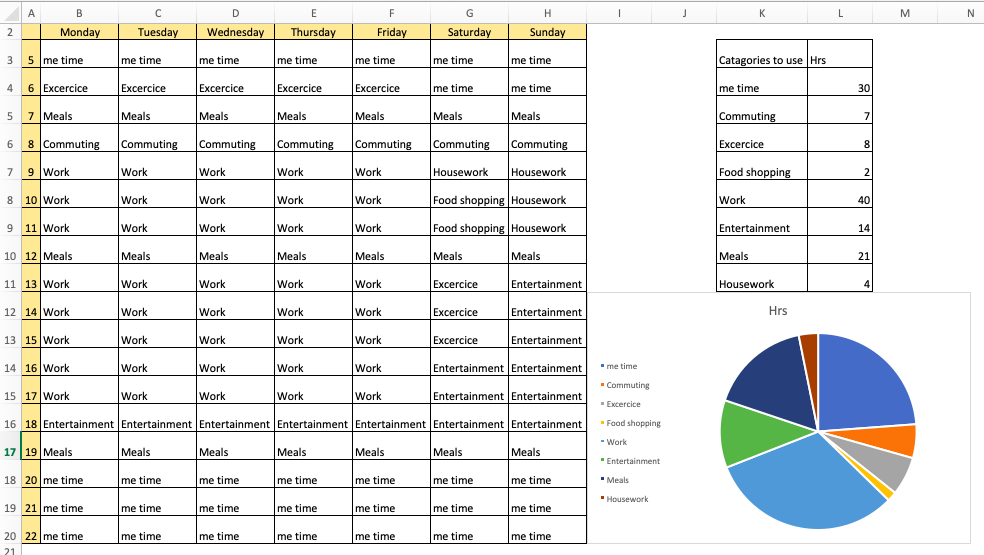
The formulae we’re going to use is =(Countif(range,criteria). We make the range the table and the critiera the category to the immediate left of where the formulae is. So in our example it looks like the below picture:
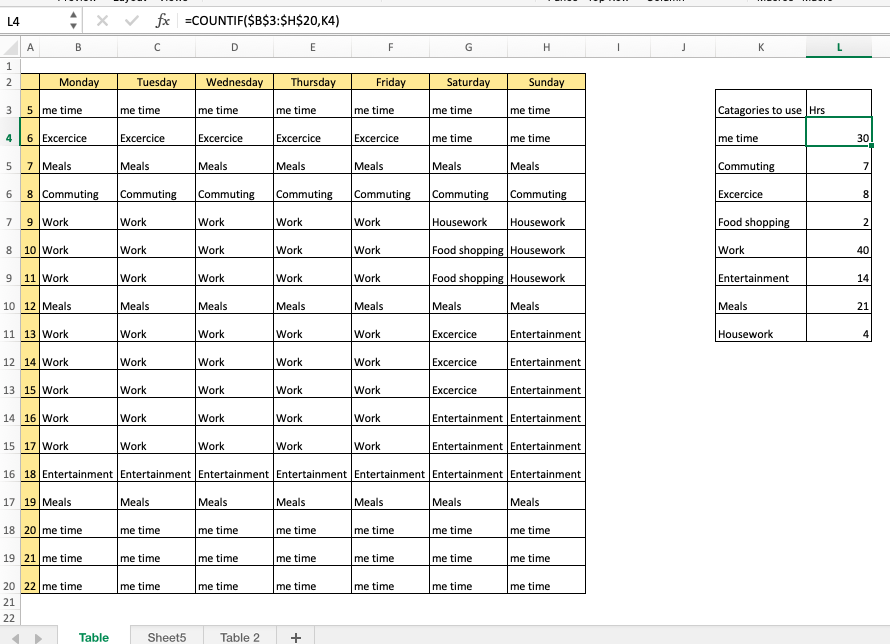
Our Formulae in cell L4 (which counts the occurrence of “me time”) is
=COUNTIF($B$3:$H$20,K4)
The range $B$3:$H$20 is the table we’ve entered the data in and K4 is the “thing” we want the formulae to count – in this case the text “me time”. Note the text has to be exact. It’s counted 30 occurrences of “me time” in the table.
The time management chart
OK so now for our time management chart.
So we build our chart from our count of each category.
Building the chart is fairly easy. We select our data range (our table with our countif formulae). Now we select insert chart from the menu. Now you could select any chart type you like but for this sort of thing we think for time management a pie chart works the best.
Our pie chart looks like:
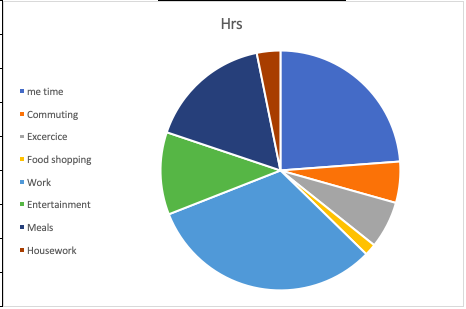
OK – so with a little formatting of the table our finished time management analysis looks like:
Pretty funky eh?
Ok let’s now look at another way of producing a time management chart.
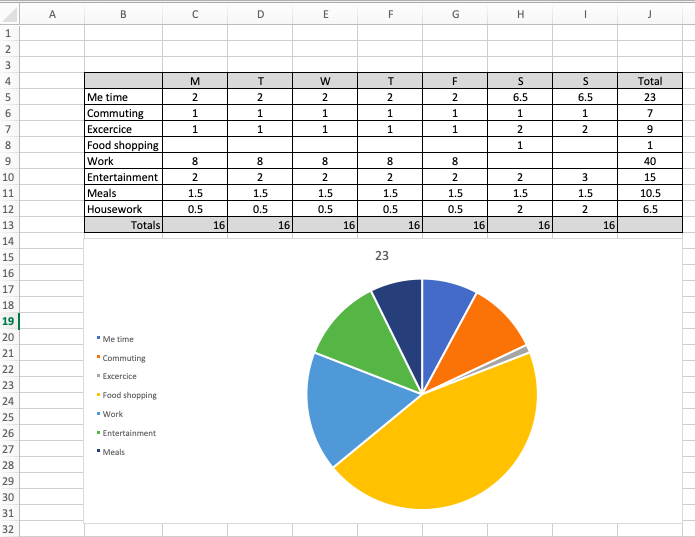
2/ Time management chart using daily totals only
OK so in this one it follows the same basic principle of our first example but in this one we skip the time based approach (removing the hours down the left) and structure the table to record our data like this……
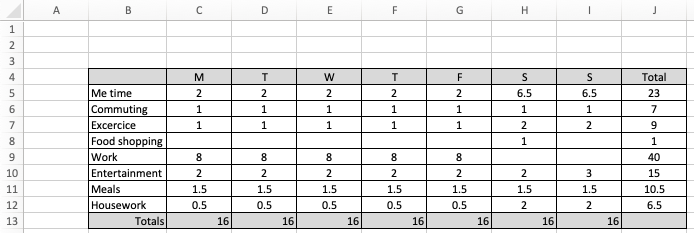
In this example we’ve kept our days along the top of the table but down the left we’ve removed the hours and replaced them with the categories that we’ll track with the idea that the user will populate the table with what they’ve done during the day.
In the example above we’ve entered the fact we’ve commuted to work for 1hr on Monday – but we have not recorded the when.
We add columns for the days that we want to record and slam in a Totals (which uses the =SUM formulae) column at the end so that we can use this to populate the time management chart we’ll create.
We then create our chart through selecting the categories and the total (down the left) as per below (the red arrows indicated the area selected). (don’t select the whole table just select the columns indicated).
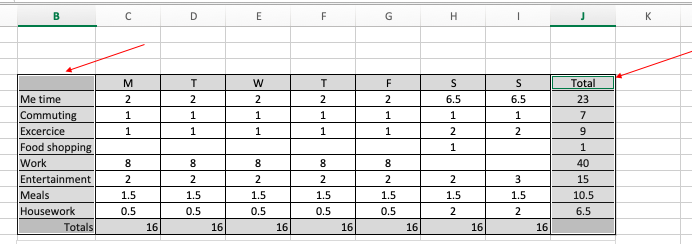
With those areas selected we produce our time management chart by using the Insert > Chart menu option:
The end result looks like this:
So now we’ve shown you how to create a time management chart, let’s take a brief look at how time management can help you achieve your goals.
Why use a time management chart/how a time management chart can help you.
There are loads of time management tools that you can utilize and we’re not going to cover everything here (but check out our other posts!) but a time management chart can offer you an introduction into assessing what your doing right now and how your life can better be tuned to meet your goals.
The key benefit from using a Time managmeent chart is that you can:
- Visualize how you utilize your 168 hours per week
- See how much time is taken by your regular comitments
- See what time is left to undertake your goals/objectives
- Use it to track targets against actual time spent
As with most things, whatever you’re trying to do (and struggling with the demands of your everyday life is no different) using a standard process and the correct tools can help considerably.
While often using a “to-do” list can help you can boost your effectiveness by monitoring how you spend your time allowing you to review your current practices and behaviours, enabling you to change and align yourself to your goals.
Common issues with using time management charts.
OK so finally let’s look at some common problems and issues associated with using this tool
- The tool needs to be used consistently – seems obvious but if you don’t use it often (and learn from it) – it’s going to be pretty pointless. The whole point is that it can help you tune your time spent so that you ensure you’re focusing on the things that add value. Of course there’s a temptation to use it once, tune your life and forget about it but using it consistently can help you identify if your old (bad habits are creeping back in.
- Peoples time is sometimes difficult to divide up into portions – the principle of producing the time chart is that it assumes that your activities can be nicely segmented into chunks of time that can be analysed, for many people there lives arent run like that and many find themsleves running various activities simultaneously. In these cases you’ll need to consider how you can best analyze your time to feed it into your time management chart.
- Does’nt account for poor goal setting – no matter how good your anlaysis, if you’re goal setting is poor then you’ll not get the best benefits. You’ll find yourself using the tool – to help you prioritize spending time on things that don’t add value.
- Being busy is not being effective- you’ll use the time that should add value but you’ll use it ineffecitvely.
- Distractions still happen, and can take you off plan if you fall victim to them
Time management chart – a summary
OK so there’s our post on how to create two different type of time management charts using Excel. As you can see they are super easy to create and can help you focus your time on the tasks that matter. Have some feedback? Do you use time managmenet charts as part of your liftestyle? How do they work for you? We’d love to hear tips/tricks – feel free to use the comments section below or fire us a message on twitter.