
As we know there are a great many tools out there to help us in our continuous improvement task from 5s to control plans through to Value Stream Mapping.
For me, a great tool to use, but one that doesn’t always get the plaudits it deserves, is the SIPOC Diagram.
In this article, we’ll look at what a SIPOC is, how it works and also show you how to create a SIPOC template using Excel.
First of all – what is a SIPOC?
A SIPOC Diagram is a tool that’s used to identify the relevant aspects of a process and is typically used within a business improvement context. The tool is designed to capture the process at a high level and while it doesn’t take the place of a standard process map (or value stream map) it’s often used along-side one.
As we know, processes can be complex beasts and breaking them down to an understandable and presentable level can be hugely important when you’re trying to improve them especially when you’re doing that as part of a team and you want everyone on the same page.
How to complete a SIPOC diagram
The SIPOC model is a process map that breaks the process down into 5 areas
S – Suppliers – who supply into the process
I – Inputs – what is supplied into the process
P – Process – what are the process steps
O – Outputs – what are the outputs that the process creates
C- Customers – who are the customers of the process.
Whilst you could simply map the process, the beauty of SIPOC is that it provides much more additional information.
The SIPOC name drives your improvement team to capture all elements relating to your process improvement project and in helping to break down the process to a greater level of detail can help simplify what could be a complex process down to one that can be well understood.
Whilst the concept of SIPOC is fairly simple it’s construction can vary based on the complexity of the process under scrutiny.
How to create a SIPOC template in Excel
Luckily the SIPOC diagram is fairly simple to put together in Excel being a culmination of columns and formatting.
There are two styles to consider and you can see those below. (note we’ve included the references for columns and rows in the screenshots so you can easily replicate).
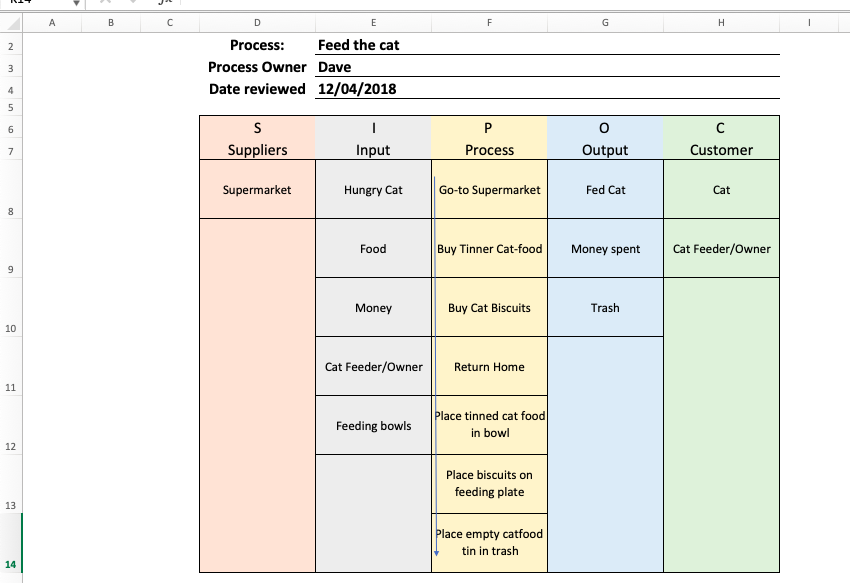
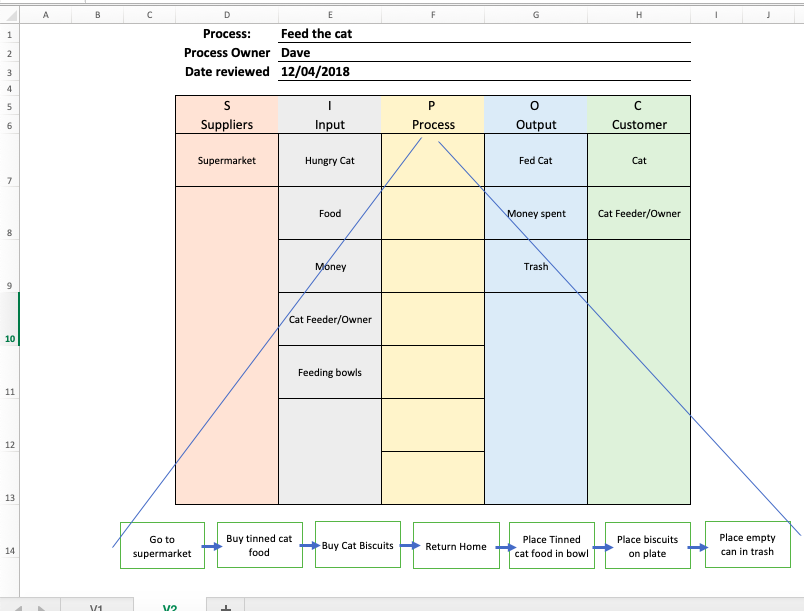
In the first one you can see that the process is listed sequentially, in the second it is displayed in a series of boxes below the columns.
Let’s see how we put it together.
1/ The first thing you want to do with any template like this is to add some titles and references, here we list out what process the model refers too, who constructed the process map and when it was done. Here, we’ve increased the font size (18 in this case) to make that obvious, and formatted as such so that it fits in with the width of the SIPOC.
2/ The next thing we did was create the 5 columns of the model. For each, we listed the initial of the column at the top, underneath we wrote the full title i.e. S & Supplier. For the heading of each column, we kept to font-size 18. We then formatted each column a different color as we thought it helps each stands out. We also standardized the column widths.
3/ Following on from this we standardized the row height (we selected 7 rows beneath the column headings and while selected we adjusted the height of one so they all matched, we chose a size where which could hold the information required.
4/ For each column we then entered our information/data.
5/ For the Process column we wanted to indicate the process flow so we inserted an arrow shape at the left-hand side of the Process column.
6/ Where data was present in a column we formatted that cell with a border and then to finish we placed a border around the whole model.
In the second version of the SIPOC, we left the process column empty but inserted rectangle shapes to represent each process step and then used arrows to indicate the flow. We inserted two lines to show how the process flow was related to the process column.
Clearly where you’ve got a more complicated SIPOC the height of each column might vary but remember your summarizing the process so don’t go over the top with information capture.
And that’s all there is to it, formatting, text entry and some shapes -simple.
So now we’ve created a SIPOC let’s look at how we complete one.
How to complete a SIPOC
1/ Map out the process section first – make sure this is at a reasonable level that the team can understand.
2/ Validate the outputs, This is an excellent “go-see” opportunity where you can involve yourself in the process
3/ Capture the customers of the process – go and speak with them – is the output what they want/expect?
4/ Once you have the outputs/customers identified, review the inputs with a focus on looking at what makes the process steps function correctly (spend time on this one – it can be a key area to get wrong).
5/Once you understand the inputs, take a look at the suppliers, where the inputs come from – note this doesn’t necessarily mean an external supply-chain (although it might involve one) but it focuses on what feeds into the process.
Once you’ve populated your SIPOC it’s a good idea to get it verified, speak to those involved in the process and share your document, is it representative of the process? How would they tweak it? Note these individuals are more likely to know the process than you so be prepared to take some criticism.
Why use a SIPOC
For those individuals who are more familiar with other process mapping methods (VSM etc), one of the questions that I’m often asked is why SIPOC?
For me, the SIPOC provides three key benefits
1/ The process detail – this enables the change team to review the process and focus on the areas that matter.
2/ The visual format – this forces the change team to review the process end-to-end in a simple format
3/ It forces the team to engage with stakeholders
What can go wrong with a SIPOC
While it’s an excellent tool there are a few things to think about
The SIPOC model itself is fairly simple and other than re-arrange the columns (or miss one) it’s hard to mess up so of course, it’s what goes into it that counts. Here are a few common errors.
1/ Don’t skimp on the process map
2/ Talk to stakeholders don’t guess
3/ Validate your process
4/ Sit back and translate your SIPOC, does the input lead to the output
5/ Don’t guess
So there you have it the humble SIPOC diagram.
We hope you give the Excel template a whizz. Also please do check out our Problem Solving Guide that’s full of further tools, tips and templates.
As ever we’d love to hear some feedback below.