
Imagine if you’ve undertaken a massive project that you had assumed would deliver significant improvements to your organization. However, before you started you hadn’t taken the time to work out what those benefits are, what impacts they would have and importantly whether they outweigh the costs of implementation and sustainment?
You could find out that you’ve spent a significant amount on something that hasn’t helped your business.
To mitigate this, most organizations utilize something called the Cost-Benefit Analysis process, which calculates the financial benefit based on a series of inputs (namely all one-off and recurring costs plus all one-off and recurring benefits). Subtracting the total costs from the total benefits gives you the impact of the project in financial terms to your business.
Utilizing Cost-Benefit Analysis is very common and it’s typically undertaken at the very start of a project (usually to determine if it’s worthwhile progressing).
In this post, we’ll look at how to create a Cost-Benefit Analysis template in Excel plus look at the background of the process together with a few things to watch out for to ensure your process is optimized.
So let’s get stuck in.
What is a cost-benefit analysis and why is it important?
As we described above, the cost-benefit analysis tool is a process that is used to compare the overall costs relating to a project to the benefits that may be produced.
The primary benefit of the tool is that it provides a quantifiable result that can be used to understand and communicate the financial impact of a project. From the outset, this assumes that the project can be quantified in financial terms (for example many projects may have non-quantifiable benefits i.e. customer satisfaction that is a key factor in project launch.)
Cost-Benefit Analysis tools are typically used by the project leadership to determine the viability of a project during the project initiation phase.
What is a cost-benefit analysis process?

Cost-benefit analysis is typically conducted over several steps, these usually include:
Determine the measurements that you’ll use to determine the Cost/Benefit? Have a clear and consistent method of determining your cost/benefit analysis, one that is easily communicable to your stakeholders
Utilize a standard currency? It might seem obvious but you’ll want to ensure that all costs/benefits are shown in a standard uniform currency
Determine the project goals? By having a clear view of your objective you’re better informed on what data to gather to support your cost-benefit.
Gather good data? The result of the Cost-Benefit will be driven by the numbers that you use. You need to ensure you have access to good data and that’s foremost accurate and secondly acceptable to your key stakeholders. Remember that you are likely to have one-off costs and recurring costs that may stretch out into future years.
Gathering data around benefits can be tricky – you’re likely to have benefits that produce a financial benefit (i.e. a saving) and an intangible benefit (i.e. customer satisfaction). Sometimes they are as important as each other, sometimes the intangible benefits outweigh the financial ones. Cost-benefit analysis templates invariably focus on the financial elements although you can depending on your situation, look to accommodate both.
Don’t ignore other projects/scenarios. There could be several options open to you in terms of project deployment which might lead to different Cost-benefit results. It’s important to utilize the tool as a modeling tool where you can run numerous scenarios and evaluate before making your final decision.
Who are your stakeholders and how will they utilize the Cost-Benefit? Draw up a list of your project’s stakeholders and determine how they will use the analysis, perhaps they are a decision-maker and will use the results to determine a way forward? Perhaps they are a member of the deployment team who will utilize the analysis to validate results against. Whichever way, look to see how the tool and its results will be used within the project.
What does the Cost-Benefit Analysis tell you? Does the analysis provide clear direction? If not why? What changes to the analysis need to be made and where you are scenario planning do you need to make these changes to all scenarios?
Determine your NPV process for the analysis. Many Cost-Benefit Analysis models will utilize a form of discounting so that you can review benefits at current value, this is a step that’s often missed and as a result, the analysis can sometimes be misleading. Have a process agreed for this before you start?
Utilize some form of Sensitivity Analysis? How certain of the input/output are you? Is there any risk around the numbers your using? How can you mitigate this?
Next steps? Great, you’ve produced some analysis, now what? Have a procedure determined upfront where you’ll know what you’re going to do with the numbers (perhaps part of your project initiation phase?) and how they play a part of your project’s next steps.
How to create a Cost-Benefit Analysis Excel Template
Luckily creating a cost-benefit analysis template in excel is fairly straightforward. Whilst you can utilize some of the features in Excel to help populate the table (such as the NPV formulae) if you like, you can also produce the template as a blank table that you can populate with the appropriate data.
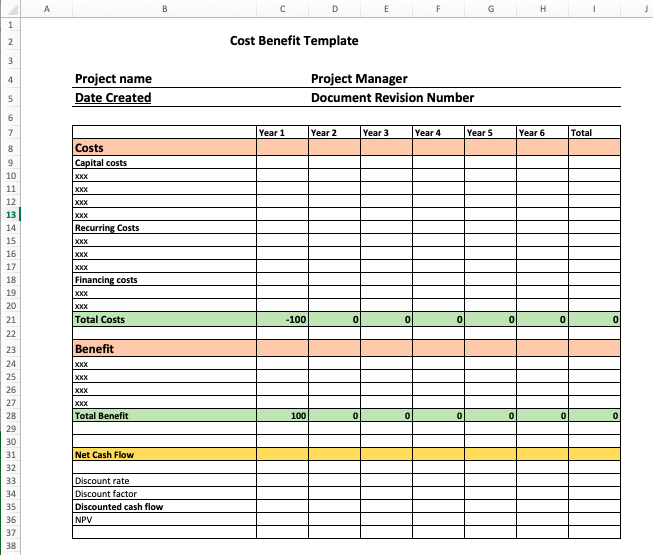
We’ve pulled together a template that you can see below:
You can produce this with a little basic knowledge of formatting and data entry.
As ever before you start with this sort of thing it’s important that you map out what you’re trying to achieve and a structure for the template that works best for you. With ours, we’ve segregated it into 4 broad sections
· Header – the title, owner, date created, etc
· Costs – (we’ve separated capital and recurring costs – you may have others such as financing costs etc)
· Benefits – here we’ve listed financial benefits only – I’ve come across various templates for Cost-Benefit that show intangible benefits (non-financial) but in our template we’ve stuck to financial ones only
· Discounted cash flow & NPV – again we’ve seen some templates with and some without – it’s a good idea to use it so you’re comparing apples with apples but it’s a personal choice.
So let’s take a look at each section in a little more detail.
1/ The header – This lists the salient points relating to the project, in ours it contains
* Project Name
* Project Manager/Owner
* Date created
* Document revision number
Note the above is a personal choice and you may well choose to add/delete element to that section.
2/ Table Header
As the cost-benefit will be constructed in a table let’s take a look at what information we’re gathering by reviewing the header. it contains:
- Description (note the table is split into Costs & Benefits)
- Period – in our template we’ve shown it as Year 1 through to Year 5
- Total – here’ we’ll use the SUM() command to add up the contents of the period columns
3/ Costs
OK – so now we have our table established, now we’ll start on populating the information we want in the costs section: – here we’re going to split the element into several sections that are relevant to our business/project (again results may differ for your project). We’ve split them into
· Capital costs
· Recurring costs
· Financing costs
At the foot of this section of the table (we’ve shaded it in green) we’ve added a total column that you can use the SUM() formulae to calculate each row,
What’s key here is that the table is segmented how you want to view your costs in relation to your project/business – note we’ve chosen types of costs – you might want to segment parts of your project i.e. hardware, software, resources or maybe align it to how your business typically reports its finances, the choice is yours.
4/ Benefits
Now we’ll add the benefits – in much the same way as we added costs we’ll define the benefits in how we want to see them – here we’ve chosen to have just one group – again you may chose to visualize them differently.
Once again we’ve totaled them at the bottom of the table element ( again highlighted in green).
5/ Net Cash Flow (in yellow on our example).
This row looks to calculate the benefit (or otherwise) of your project and should represent Total Benefit – Total Cost
6/ Discount rate & NPV
I’m not going to go into detail here on how this is calculated (you can go here or here for that) – or even say you should definitely include this section (there are pro’s/cons). However, for completeness, I’ve added this to our template. Its purpose is to show the financial benefit at today’s rate (i.e discounted from assumed growth of later periods. We’ve included the following in this section
· Discount rate – what rate we’re applying to later year totals
· Discount factor – the % discount rate for each year
· Discounted cash flow – the actual benefits calculated using the above
· NPV – the NPV for the series of years being calculated
What are the problems with Cost-Benefit Analysis process.
So now we’ve been through how to create a simple excel cost-benefit analysis template we’ll take a look at some common issues with the process so you can look to steer clear of them in your methodology. Unsurprisingly many of them center around the quality of the data.
· Accuracy of numbers
Clearly, you need accurate data in a tool like this, where/how you obtain the data can be crucial. Do not attempt this form of analysis (especially if you’re going to use it drive project start) if your analysis is based on poor data.
· Completeness
Similar to the above – consider how you’ll capture all the data you need. Often teams might miss a category of cost – this is often determined by those stakeholders that participate in the analysis, consider who in your organization has access to the data and spend time considering what needs to be included and why.
· Benefits & Benefits realization
Project managers love to start projects and can often be overly optimistic in terms of what benefits can be derided (after all they want their project to be launched and for it to be viewed as important -yep Project Managers have egos!!). Be careful that you are sensible about your numbers, make sure they are grounded in fact and where you do forecast this is done with a level of pragmatism.
· How should you treat nonfinancial benefits
One of the common conundrums is how to treat non financial benefits (i.e. customer satisfaction). These are often as important as the financial ones and analysis such as this excludes them. This often requires alot of careful thought.
· Scenario Planning
Don’t just do one level of analysis, scenario plan based on different ‘ingredients’. You want your project to be optimized and there may be several ways that it could be structured releasing different costs/benefits. Take some time to scenario plan so that you can consider these.
· NPV/Discounted rates
Without a doubt, this has a level of complexity around it. It’s perhaps best left to stakeholders that fully understand it (hey that’s your finance department) so that the numbers are accurately interpreted.
Summary
So there you have it, how to create a simple cost-benefit analysis template in Excel with a quick overview of the process!. We hope you found it useful – as ever if you’ve got comments or feedback please use the feedback section below or feel free to fire us up on twitter.
This post is part of our Management & Leadership Guide.