When it comes to continuous improvement we’re all about standard work and following a structured approach. following a standard method brings the best benefits (check out this excellent piece for more information on the benefits)
When it comes to problem-solving the same’s true, following a hap-hazard process rarely brings with it the same benefits as a standard approach. The good news is that there is a vast array of problem-solving tools and they come in many shapes and sizes.
Part of the challenge in flowing a continuous improvement ideology out into the business is that you need to empower the workforce with simple but powerful tools that help deliver on the promise.
The A3 report is one such tool and is a simple but powerful tool for driving problem-solving.
The benefits of using an A3 problem-solving report
One of the many benefits of the A3 report standard is that it’s simple to follow and provides a step by step process. Minimal training is required and providing all the data is captured within the A3 report itself then it offers a complete problem-solving process.
The A3 report is named after the intention of the report to fit on one A3 sized piece of paper and the structure of an A3 report originates from the Plan-do-check-act cycle of improvement.
Following such a template allows for the rapid assessment (and resolution) of issues within the workplace, empowering the operators with a simple process to follow.
If you’re looking to solve process problems using an approach like the A3 standard report can offer many benefits.
One of these is that it facilitates collaboration within the team and allows them a single place to capture the issue and proposed actions.
What goes into an A3 report
A3 reports can vary greatly from one company to another, however, they share a number of elements:
1/ The A3 report portrays the entire plan
2/ it provides a “story” through the PDCA cycle
3/ It focusses on the problem-solving process
4/ It encourages dialogue and collaboration among participants
The A3 report works in different sections to capture and communicate the information around the issue and what’s being done about it. This allows all the information to be collated in one place facilitating more informed, decisions to assist with the process.
A3 report template contents
A typical A3 report will capture and provide information pertaining too:
* The Background of the problem
* The current state vs the ideal state (being clear about the Gap between the two)
* A review of the root causes relating to the problem
* Recommendations/change
* The key actions around the resolutions implementation plan
* An area to describe the results (specifically any lessons learned or follow up required).
Finally one of the additional benefits from A3 is that it can be used as a “teaching aid” allowing other operators to “learn” from the process and findings. A3’s are brilliant at enabling managers (or others for that matter) to foster an improvement ideology within the workforce
So let’s get to it and look at how we can create an A3 problem-solving report in MS Excel
How to create a A3 report template in excel
Firstly the good news. As a template this only requires a modicum of excel skills, there are no formulas/calculated fields in this template and all you need to know is two basic skills:
1/ How to Format cells
2/ How to Merge cells
In this how to we’ll look at how I created this template below, (click it to en-biggen it!!)
(click here for a PDF A3 report)
As you can see, I’ve chosen to format the report in grey and use the areas where you’d enter data white.
I’m assuming that you know how to format so we’ll just cover each section, I’ll include screen shots showing the cell ranges so you can copy what I’ve done here, the only thing you’ll want to ensure is that when you have your report complete you set the print settings to print all on one landscape A3 page.
Finally, please note this is my version of an A3 report, a quick google will show you there is a vast range of examples out there, the key, as mentioned above, is that while they may differ in appearance they follow the same rudimentary structure.
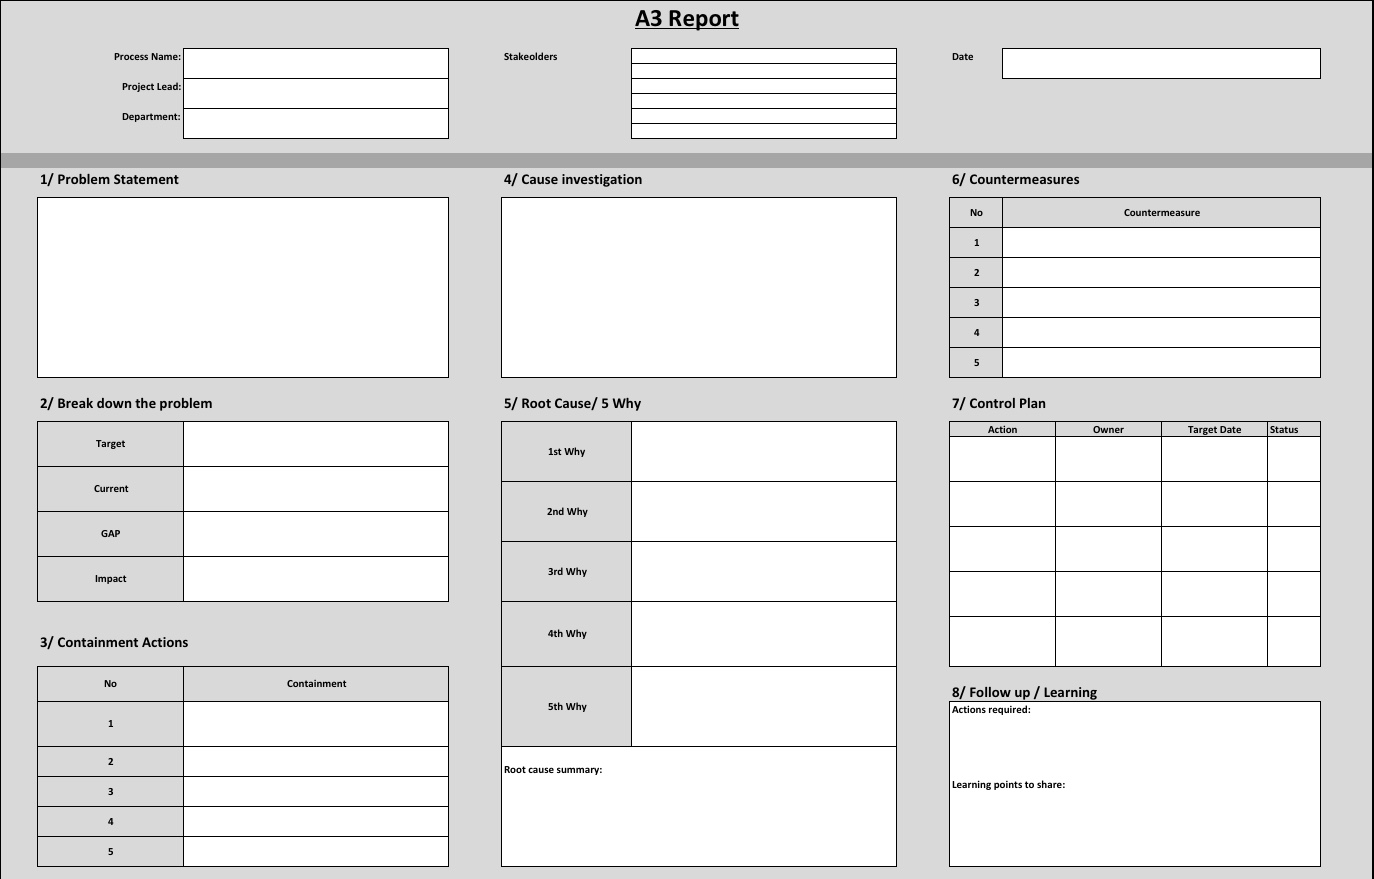
The Template is divided into 9 basic sections
The A3 report Document header
The header contains the “A3 report” title in a merged cell across the report
And the following “fields” to capture data: (Note I’ve grouped these into 3 columns)
Column 1:
* Process Name
* Project Lead
* Department
Column 2:
* Stakeholders
Column 3:
* Date
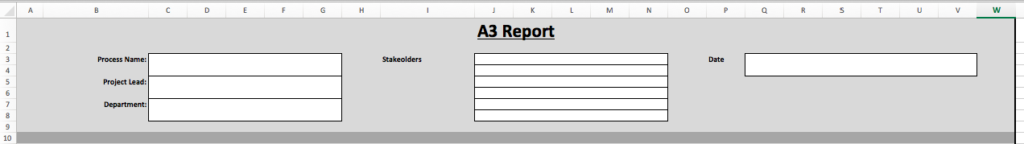
Section 1: Problem Statement
As you can see from the screenshot this features a field name and merged cells to allow data entry relating to the issue being reported
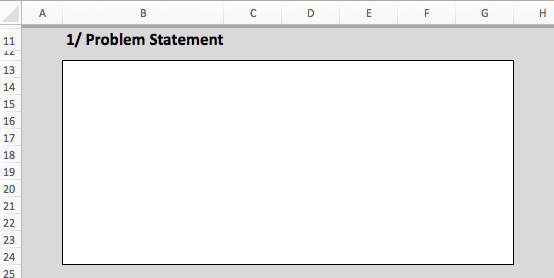
Section 2: Break down the problem
This section uses merged cells formatted to support capturing data for:
* Target (the way the process is supposed to work – this might be the Qty produced or other)
* Current (this relates to the current state – what is happening now)
* Gap – this field is designed to articulate clearly the gap between the target and current state
* Impact – this field is used to articulate the impact this is happening on the business. This could be free text (i.e. you write a description) or you use an indicator such as High, Medium or Low.
Section 3: Containment actions
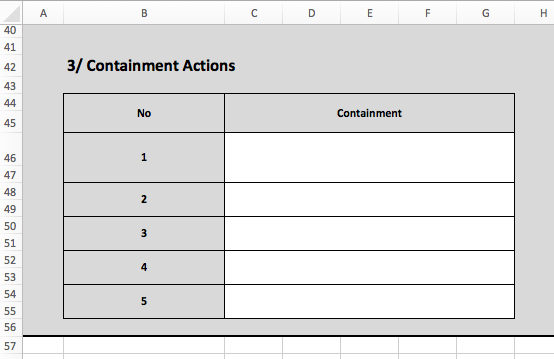
This section uses a column of entry fields to capture the initial containment actions to help/stop the issue (note this is not the end state but merely captures those containment actions initiated initially.
Section 4: Cause investigation
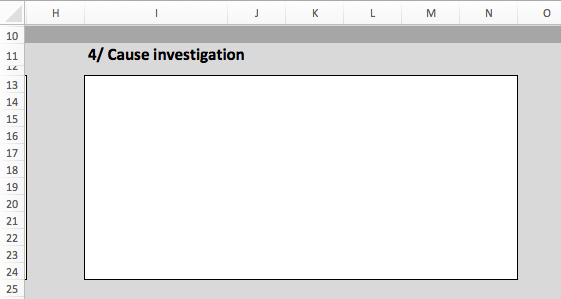
This section (and Section 5 below it) are used to articulate (or help establish) the root cause. Section 4 is a free text area that allows the user to articulate the steps taken to review the root cause.
Section 5: Root cause / 5 Why
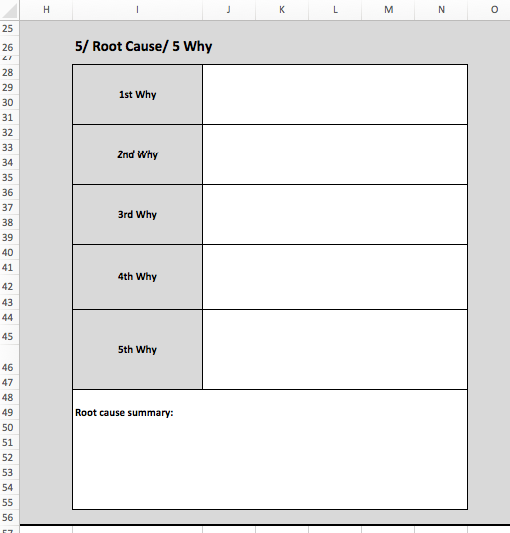
5 Why is a powerful tool and can be readily transported into an A3 report. For those that aren’t aware of the process 5 why is an iterative technique used to drill down to the core cause of an issue.
Section 6: Countermeasures
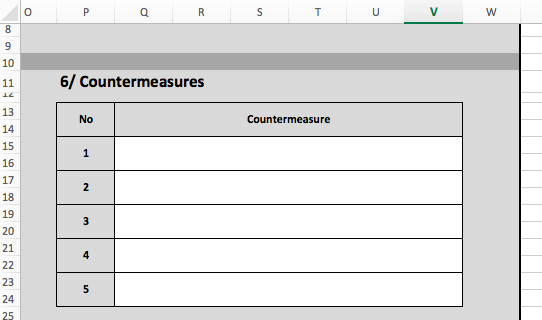
This section uses fields to capture the countermeasures deployed to fix the problem.
Section 7: Control plan
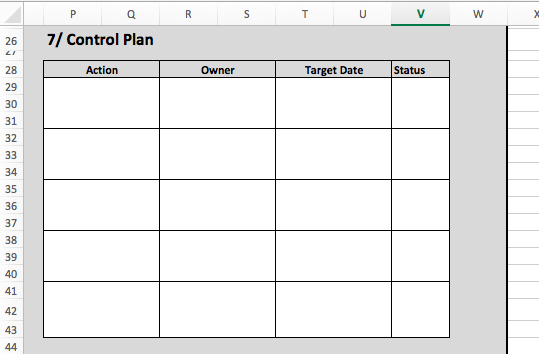
This section captures the summary level action plan via a 4 column table which obtains
* The action
* The action owner
* The target date
* The status
Section 8 Follow up learning
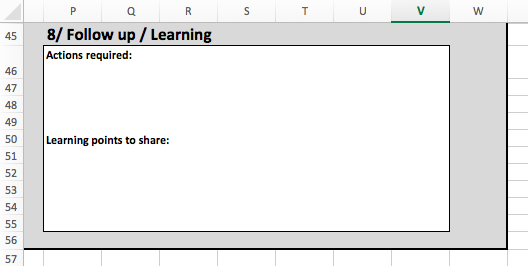
This section by way of merged cells allows the capturing of information pertaining to Further actions required and key learning points to share.
So that’s our A3 report excel template, have some comments or suggestions? Please feel free to leave them in the section below.