Here at Sanzubusinesstraining.com we love tools that help us solve business problems ( if you’re the same you might like to take a look at our Problem Solving guide that includes further tools like A3 Problem Solving Template or our Kaizen Card Template)
We believe that if you choose to follow a standard process for resolving problems the battle is already half won, I’ve lost count of the businesses I’ve seen who approach this sort of thing ad-hoc with each problem being targeted with a unique process/perspective with ahem….varying results.
So, standard methodology/consistency wins every time, especially where the audience is one that is multi-disciplined (i.e. consists of Engineers, manufacturing team, Quality, Supply-chain for example).
In previous posts we’ve covered Problem Solving Tools like the A3 report, another tool that’s commonly used to solve business problems is the 8d report.
While it’s often called an 8d report, 8d is, in fact, a methodology. There is an 8d process where the report (the 8d report) is the output.
When your business faces problems with its products (either finding this out yourselves or being informed by your customer) the 8D method provides an invaluable starting point in driving improvement in Quality
What makes a good problem-solving tool
One of the challenges for selecting problem-solving tools is what exactly do you look for? In Lean the best tools for problem-solving tend to have the following attributes:
* They facilitate team-work to solve problems and help create an open dialogue between those participating.
* They have a structure (a regimented process to follow)
* They use data and facts and root cause analysis to drive the process rather than supposition and guesswork.
* They make problem-solving (and remedy) as efficient as possible
* They support better selection and implementation of the final corrective action.
* They help with building an archive/database of problems coupled with the corrective action (i.e. they make a great learning archive).
The 8d method builds on all of these and is an excellent yet simple tool to deploy.
What is an 8D report
As we described above, the 8D Report is a problem-solving tool, that follows a series of pre-defined steps, that can be used as part of a continuous improvement methodology.
The business that’s utilizing the tool usually has someone (typically a quality engineer) familiar with the tool that can coach the other members of the team in its deployment.
Like many lean tools the 8d originated in industry, this one within automotive but as with many of the other lean tools it can readily be deployed in most businesses.
The 8D tool is often used to identify and remedy recurring problems, and is especially useful in an environment where there are “products” and an environment that has established processes.
As with most lean tools the “products” don’t necessarily have to be those within a manufacturing environment (although the tool excels in these, anywhere where there are processes that result in some form of output will benefit from an approach like 8d.
The other thing to recognize with 8d is that it doesn’t look to solve the issue temporarily rather than the method targets a permanent corrective action (eradicating the issue).
As with the best lean tools 8d uses a combination of statistical evidence and root cause analysis, and anyone familiar with that approach should be able to utilize the 8d method fairly quickly.
As described above the 8d tool follows a series of steps in order to work –
The 8D are:
1/ Establish a team
2/ Define the problem statement
3/ Define interim containment actions
4/ Undertake root cause analysis
5/ Define the corrective actions
6/ Implement the corrective actions
7/ Implement preventative actions (so it doesn’t happen again, typically this is closing the loop updating processes, FMEA etc)
8/ Close the project and congratulate the team
Using a step-based approach has a number of benefits
1. It facilitates a team approach where the whole team is aware of the process and their role in it. Problems are rarely solved by individuals and usually require a cross-functional team. By having a structured methodology this team has a process to follow with a designated output.
2. It can be deployed rapidly, indeed 8d has much in common with the Analyze, countermeasure, root-cause, fix approach that is similar to many lean tools.
As with any problem-solving project, the chance of success is greatly enhanced if you prepare first, jumping straight in without knowing the facts is likely to result in reduced success.
Ok so let’s look at how we produce an 8d report in Excel.
Creating an 8D report template in excel
As a template to create this is a fairly easy one, there are no calculated fields, so it’s just a matter of devising the report and formatting it.
You can see the 8D template below:
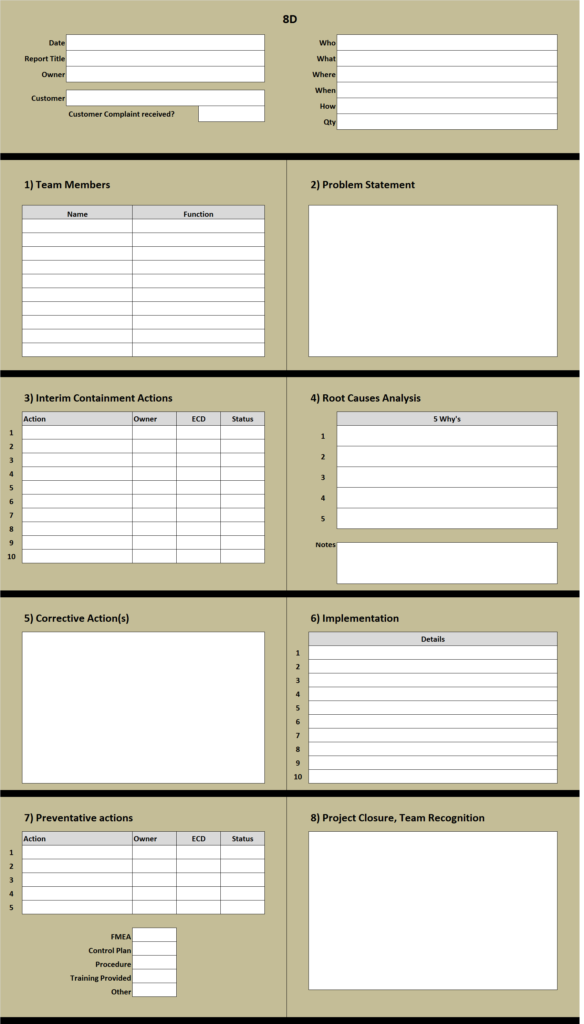
Let’s cover each section – I’ll include screen-shots showing the columns/rows so you can copy and create your own.
This reports been formatted to be able to be printed on one side of A4. To assist with this I’ve had to think about how the report is structured, place each “D” on top of each other produced a report that was too long if printed on one piece of paper so I’ve found by placing two “D’s” next to each other, you still have enough space to capture what’s required while producing a printer friendly report.
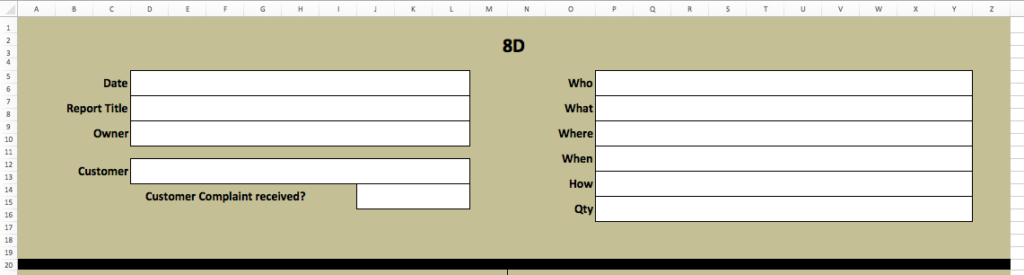
Header
The header of the 8D is used to capture background information (for example the date the 8D was raised, some generic information around the issue
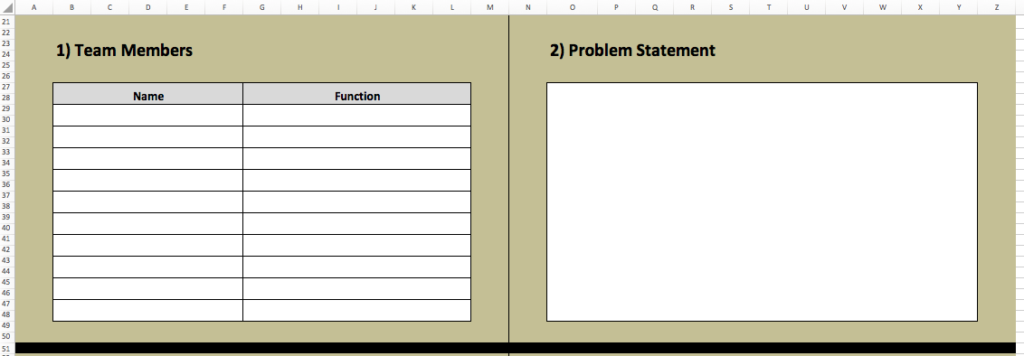
Section a) – Team Members & Probelm statement
Fairly rudimentary use of columns to capture the team members, you could expand on it to include contact details if required.
The Problem statement is just a group of cells that’s been merged in order to capture free text description of the problem.
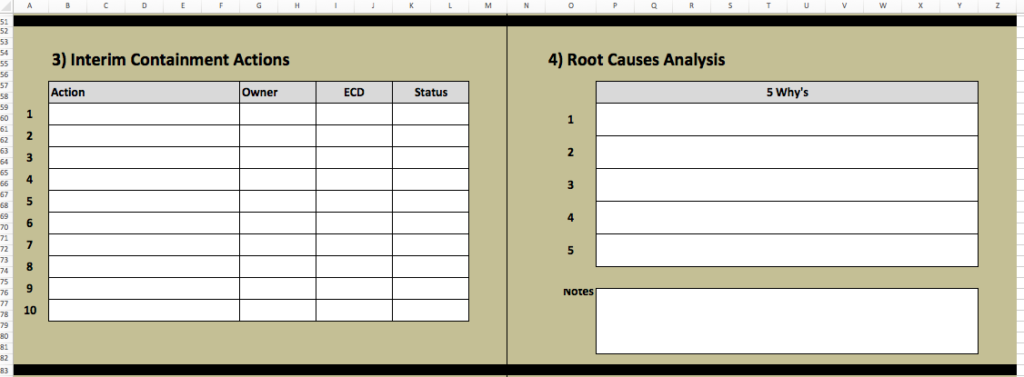
Section b) – Interim containment actions & Root Cause Analysis
This section captures interim actions via a table (I’ve included spaces for 10 actions but again you could expand as required).
For the root cause analysis out of personal choice I’ve used a table to capture the 5 Why (together with a notes block at the bottom of the section). I like 5 why as a process, but you could use a decision tree or other if required in this space.
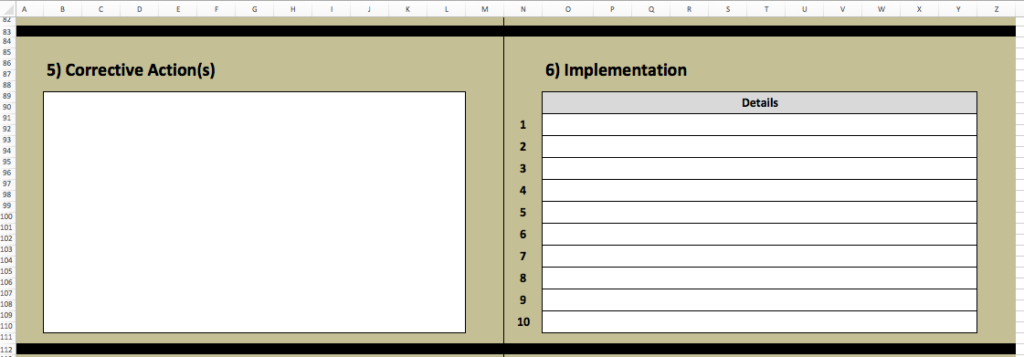
Section c) Corrective Action(s) & Implementation
For the corrective actions, I’ve used a merged cell for free text entry.
For the implementation, I’ve used a table with 10 lines to capture the implementation steps.
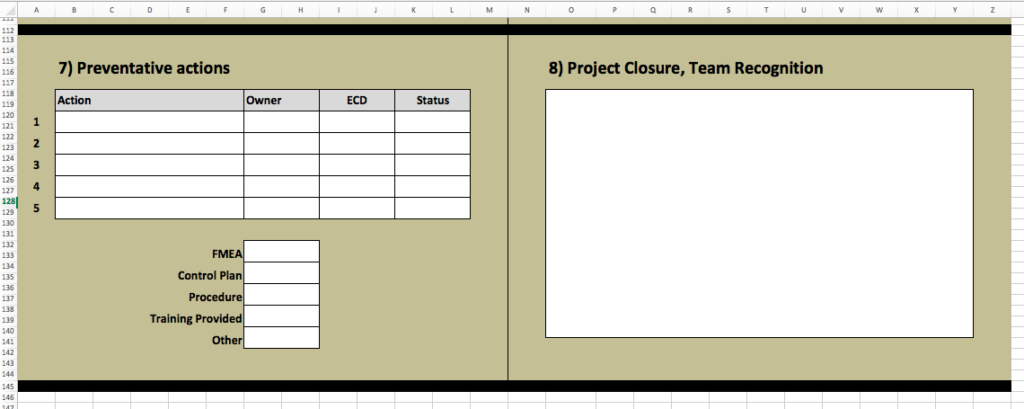
Section d) Preventative actions & Project Closure / Team recognition
For the 7D Preventative actions, I’ve used a mix of a table to capture actions and a checklist of things to do. In the checklist I’ve included things like an FMEA, procedure update etc, this is personal preference but I like the use of a tick box here as it ensures the user follows some sort of process to go an update documentation or other following the “fix” being implemented.
For the project closure section, I’ve used merged cells to create a text box for free text entry.
So there’s our example 8D report – got some comments or ideas? Use the feedback section below – we’d love to hear from you.