Problem-solving is one of those topics that we’ve often discussed on this site (check out our Problem Solving guide). We think it’s one of THE vital skills of business. Why? Because you’ll come across problems every day, and you need to arm yourself with the right tools to solve them.
A problem-solving flowchart is one of those tools. It’ll help you take a problem statement, break the problem down into likely causes helping you get to the bottom of what’s gone wrong.
In this post, we’ll cover
- What is a Problem Solving Flow Chart
- How to create a Problem Solving flow chart
- Example 1 of Problem Solving flow chart
- Example 2 of Problem Solving Flow chart
- What flow chart shapes to use
- When should you use a flow chart
- 7 tips on creating your Problem Solving chart
- Key Benefits & Likely issues with the tool
Let’s get started!
What is a Problem Solving Flowchart
A Problem Solving flow chart is a diagram that uses shapes, arrows, and text to show a moving sequence of actions and/or activities that help solve a problem.
How to create a Problem Solving flowchart
- Describe your problem.
- Pose Yes/No Questions that can help identify the cause of the problem
- Question each stage of the process until it is fully examined
- Repeat steps 2 & 3 until you have identified a solution
- Try the solution; if it is successful in addressing the root cause, then you’ve fixed your problem. If not, repeat the process until you have a solution that works.
A problem-solving flowchart attempts to identify a root cause/solution to the trigger that is causing the problem allowing you to change the process and prevent the problem from occurring.
Let’s now demonstrate the effectiveness of a problem solving flowchart by showing some examples.
Example 1 Problem solving flow chart
In our first example, we’re going to start with something simple to show you the principle of the tool.
We have been given a cup of tea and we don’t like it!
Let’s use a problem-solving flow chart to find out what’s gone wrong.
We’ve used Excel to capture this flow chart using flowchart shapes (insert –> shapes), you can, of course, use other applications to do this, you don’t’ have to have specialized flow chart software to do this. (there’s a great flowchart in Excel video here). Or you can simply use a pen and paper.
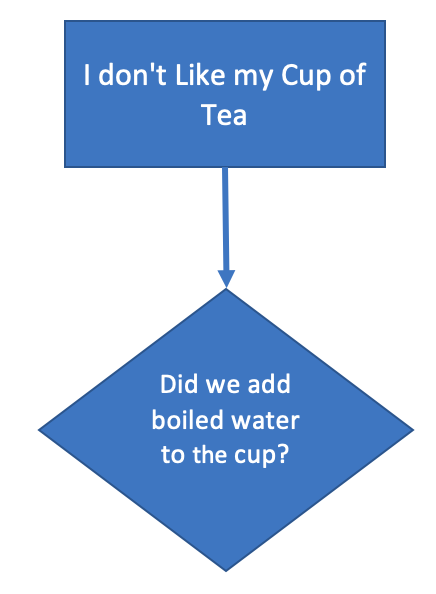
Step 1.
Use a rectangle and add your problem statement.
Remember to keep your problem statement unambiguous and straightforward. Here we’ve used “I don’t like my cup of tea.”

Step 2
Now that we’ve got our problem statement, we’re going to start asking questions.
We’re going to examine the variables that go into a cup of tea in an attempt to find out what’s gone wrong.
**TIP** – Work through your process – rather than start from scratch, if you have a documented process, work through that examining each step to ascertain if there are issues. If not, you might find it useful to research and sketch out the process before starting with your flowchart.
We have a process for the cup of tea, which is:
1/ Boil Water
2/ Place Breakfast Tea teabag in the cup
3/ Add Water
4/ Leave to sit for 2 mins
4/ Remove teabag
5/ Add milk
6/ Add sugar
7/ Stir
So our problem solving flow chart needs to examine each of those steps to determine where the failure has occurred.
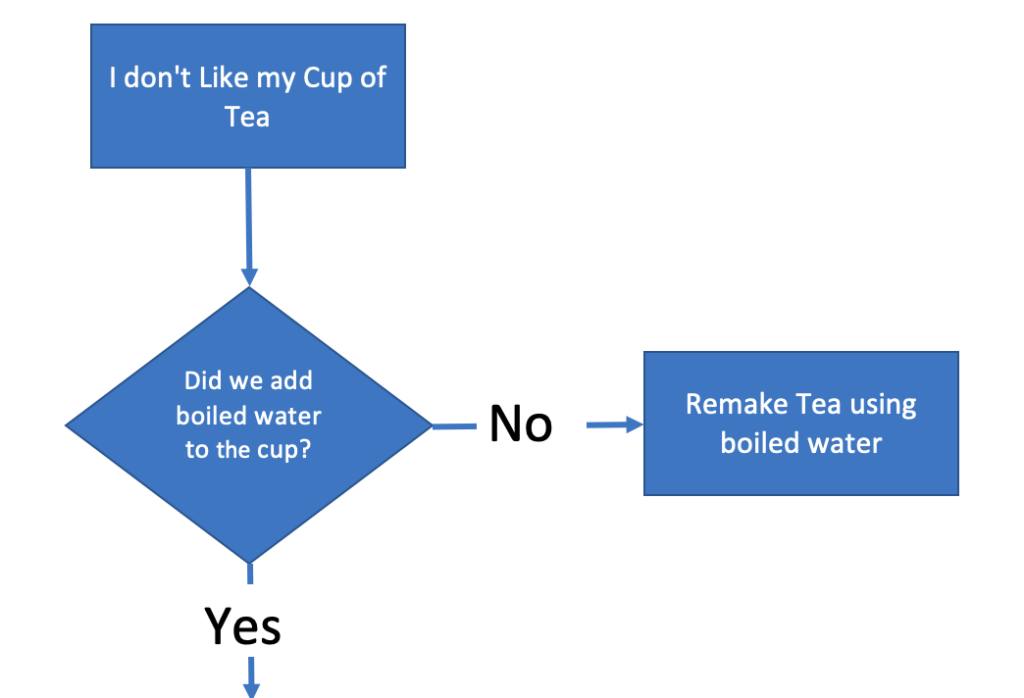
We’ll add a question shape (diamond), connect out problem statement to it using an arrow to check if we boiled the kettle. Our Diagram will now look like:
As a question, we want two possible routes – Yes and No.
Our process asks us to boil the kettle if we did, and the answer is Yes, then we can go to the next process step.
If the answer is No, then we have a problem. Our tea will be cold.
Here we can do one of two things. We can terminate the flow chart, or we can add an activity to rectify the problem (this might be to remake the drink or to perhaps heat the drink up in the microwave).
Our flow chart now looks like this:
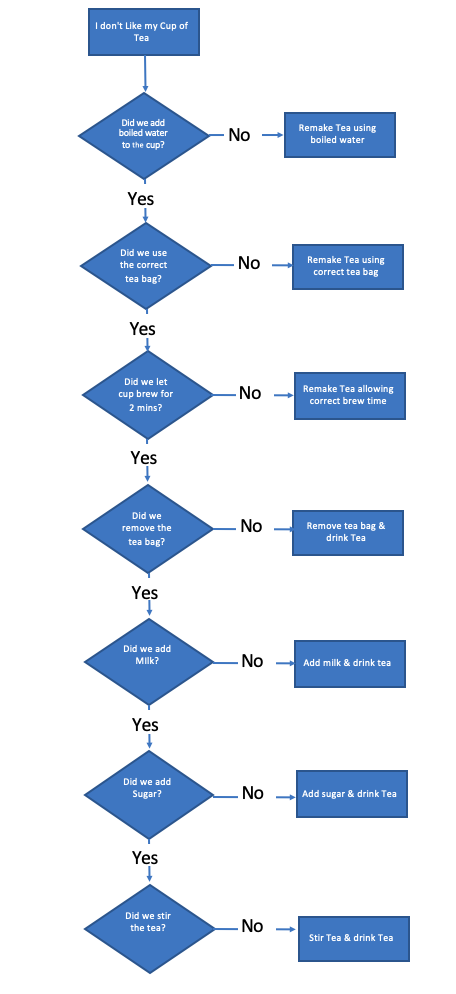
Step 2 in our Tea making process was to add a Breakfast-tea tea bag.
So, once again, we’ll ask a question about that step.
“Did we add an English Breakfast teabag.”
As before, we’ll use a question shape, using Yes or No answers. If we performed the process step correctly, we’d move on. If we didn’t, we’ll either end the problem solving (we’ve found the root cause), or we’ll add a corrective action.
Now we’ll repeat this process until we’ve reviewed the whole process.
Our finished flowchart looks like this.
However, we’re not finished.
What happens if we follow the flow chart, and we find we didn’t use boiled water. We remake the tea using boiled water, and we still don’t like it?
We need to ask some further questions.
We need to update our flow chart to validate that we solved the problem and what to do if we didn’t.
So for each step of the process, our problem solving flowchart now looks like this.
Here’s our completed flow chart.
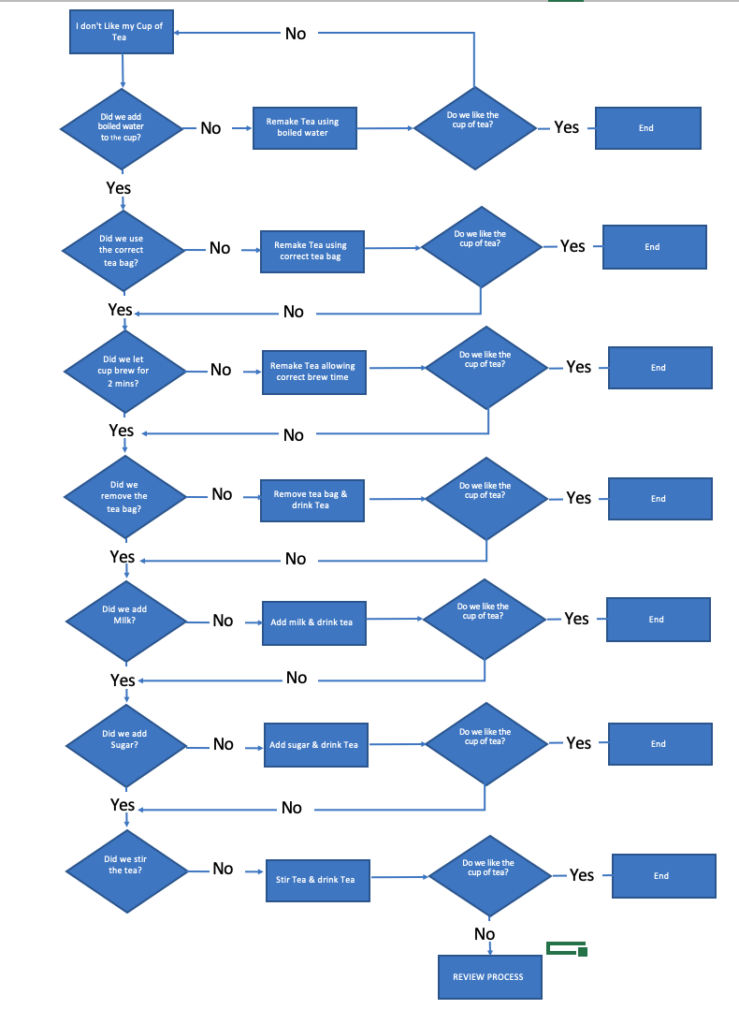
As you can see, we’ve identified the problem, and we’ve described a corrective action.
But there’s a problem here. With this flowchart, you can still follow it, validating the process, and still end up with a cup of tea that’s unsatisfactory.
Why is that?
Well, it’s perfectly possible that we started out with a process that’s incorrect. What happens if the process called for using an incorrect tea bag from the start?
So we’ll simplify things by adding a block at the end that if you’re still not happy at the end of reviewing the steps, a full review of the process will be undertaken. This is a simple answer to this problem, and I would expect that you would expand this section in more detail if you were creating a flowchart yourself.
So what does a more complex process look like, how about we look at a business problem?
Example 2 Problem Solving flow chart
OK, so example 1 may have been a bit simple, and you are maybe looking for something in a business context.
So in Example 2, let’s look at a scenario that’s a little more complex.
Let’s assume that your organization has received a non-conforming part. You have been assigned to work with the Vendor to:
- Find out what went wrong
- Prevent recurrence
We’re going to use a problem solving flow chart to help us do that.
As with the first example, we’re going to state the problem.
“The part is non conforming.”
Using the production process from the Vendor, we’ll work through the stages to see if we can spot what’s gone wrong.
The diagram below shows an analysis of the first two steps of the production process using a problem-solving flow chart.
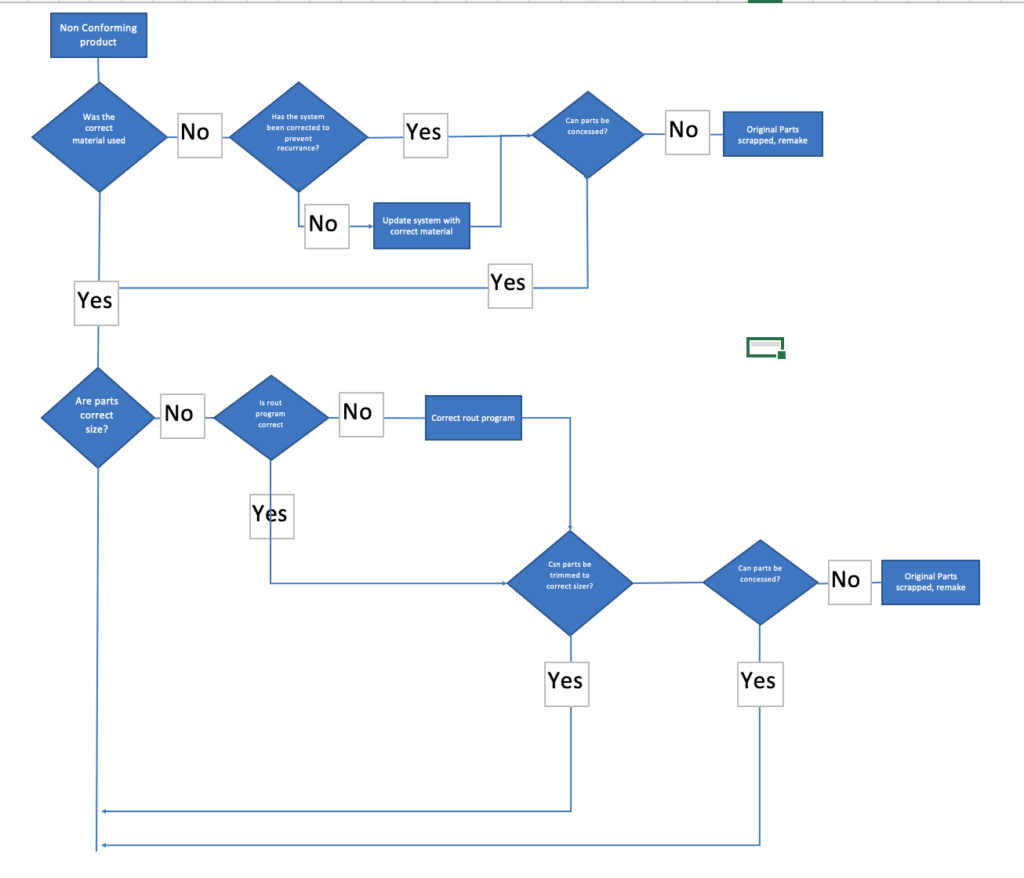
The first thing you’ll notice is that on one process step, there may be many questions to ascertain the potential issue.
Some of these may be complex and require careful thought.
There may be multiple variables (systems, processes, tools, inputs, etc.) that may require attention.
You will need to analyze each process step, in full, to be sure you have caught all the possible causes of the fault.
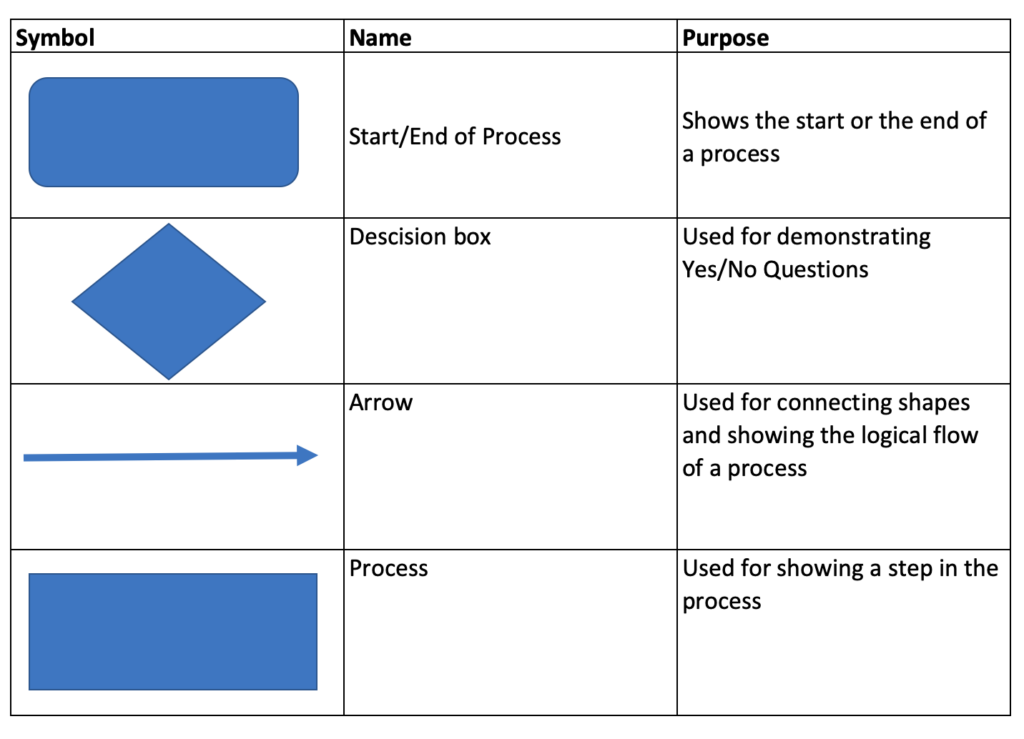
Which Flow chart shapes should you use.
A problem solving flow chart usually utilizes only a small number of shapes. We show these in the table below.
When should you use a Problem Solving flow chart
There are many many problem tools available.
A flow chart lends itself to be used when:
- You are looking for a tool that is simple to use
- You are looking to use a tool that does not require complex software
- You want to validate a process.
- You want something that facilitates collaboration
- You want something that you can use to communicate with others
7 Tips on creating great problem solving flow charts
1/ Use standard shapes!
2/ Make it easy to follow!
3/ Keep things on one page
4/ Don’t overload your boxes with text
5/ Go into enough detail. Don’t try and simplify activities as it might hide problems from being seen.
6/ Collaborate. Where you can utilize a team to help document the problem and the activities do so. The more knowledge of the process, the better chance you’ll have of locating the issue.
7/ Use a consistent direction to flow your process, moving things around the page can confuse people who might look at it.
Key Benefits & Likely issues with the tool
A flow chart can provide you with a great advantage when looking to solve problems. Some of the key benefits include
- A visual aide that’s easy to understand
- Simple to use, does not require hours and hours of training
- A tool that facilitates collaboration
- Effective for aiding communication
- Provides an effective method of analysing a process
However, as with everything, there are some issues to look out for
- Flowchart fails to capture all process steps and therefore root cause analysis is hit and miss
- Lack of knowledge of the process by the individual compiling the flowchart results in inaccurate problem solving
- Inconsistent flow of process makes maps confusing
- Complex processes may be better suited to other tools (fishbone etc)
- Inconsistent formatting and/or use of shapes result in flowchart that is difficult to utilise.
Summary
There are a great many tools out there for problem-solving, and flow charts can be used either as a stand-alone tool or conjunction with one of these other tools.
Flowcharts can make for a great problem-solving tool.
They’re simple to use, effective, and facilitate collaboration.
We hope you’ve found our article useful, in particular the example walkthroughs.
If you’re looking to use the tool, we’d love some feedback from you and hearing how you’ve got on. Why not fire us a message on twitter or use the comments section below.
This article is part of our Problem Solving Guide.