
In recent posts, we talked a lot about problem-solving tools including the 8D report, 5 Why template and Kaizen cards. While these tools are great at dealing with the problem when it presents itself to you and your business, part of the battle is coming up with methods that can identify issues before they arise and help eradicate them. One of the more popular tools for this process is the FMEA method.
In this post we’ll show you how to create an awesome FMEA Excel template
FMEA stands for Failure Mode and Effects Analysis, The FMEA a is a structured methodology used by business to help capture and evaluate risk and then monitor the success of mitigation actions (ideally improving the process by removing the opportunity for failure). Check out these case studies on how it’s used in the wild! here and here
There are a variety of different types of FMEA’s, from system FMEA’s to software FMEA’s. Processes have their own FMEA also, this is the PFMEA or Process Failure Mode Effects Analysis.
It’s a great tool for use in design as it enables you to assess the risk in various design concepts resolving problems before they occur. It’s also a great tool for evaluation processes.
One of its most positive benefits is that it enables you to present a “journey” of failure mode analysis, documenting the review of risk in a way that can be reviewed and utilized later by team members in similar situations.
In this article, we’ll look at building an FMEA template in Excel and we’ll also talk about what each of the columns is designed to do and how to use it
But first a little background info…..
How does the FMEA tool work
An FMEA is a methodology that reviews and evaluates each process step and reviews possible risks (failures) and assigns scores based on severity and likely occurrence.
This enables the business to help prioritize potential process failures and then action and evaluate appropriate mitigation.
An FMEA is typically a worksheet that is completed by a cross-functional team coordinated by a team leader. The worksheet is completed by:
* Reviewing the process (documenting it if it’s yet to be captured)
* Transfer the process to the FMEA CHECKLIST
* Scoring each step in accordance with the FMEA evaluation method (Severity of risk, Likely Occurrence and Detection)
* Agreeing how the PFMEA will be maintained and updated
Most businesses will use an FMEA as an ongoing process to get updated through the lifetime of the product/part being monitored.
FMEA is not a superhero
The process is not without its issues. There are commonly 3 key issues with FMEA (each can be overcome with a bit of planning).
1/ Successfully executing an FMEA takes up resources to complete. For really complex processes it can present itself as a significant resource burden (but it’s worth it). By planning ahead (and building the process into project plans and resource schedules) it doesn’t come as a nasty shock. Also by publicising the benefits, FMEA becomes widely adopted as the ‘can-do’ method of risk reduction.
2/ The FMEA can be inaccurate because those undertaking the activity are unfamiliar with the source material – an FMEA should ideally be completed at the Gemba so that the specific production process and details are thoroughly understood and can be embedded within the document. When considering the stakeholder group responsible for documenting the FMEA it’s best to include a wide mix of stakeholders led by someone (a co-ordinator) that’s familiar with the process.
3/ FMEA’s can become outdated, It is vital that the FMEA is routinely reviewed and updated. As processes change and evolve it can become outdated. As a minimum, the FMEA should be triggered by any change in the process.
FMEA Inputs
Finally, an FMEA will not populate itself. It does require inputs. These may come from an existing process map, brainstorming, local knowledge and experience but you have to have some data that comes from somewhere!
One of the most common first steps is transferring an existing process map into the FMEA model (obviously this relies on your process being thorough enough to be utilized.)
What does an FMEA template look like? & How to Create an FMEA template in Excel.
Firstly here’s what our template looks like, as you can see it’s designed in two sections
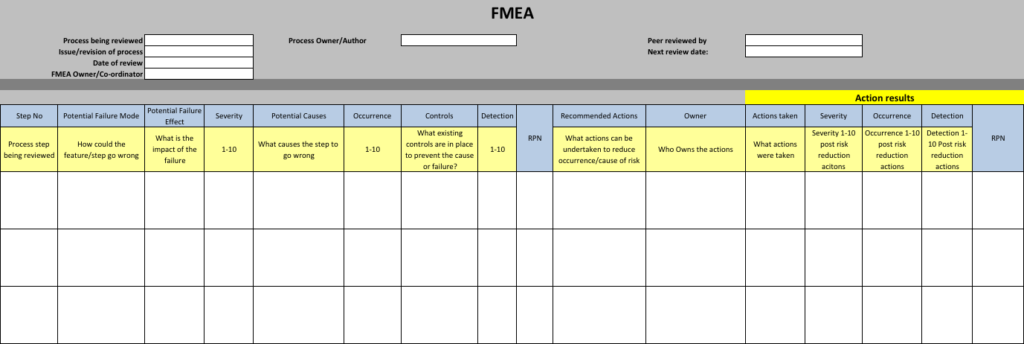
FMEA Template
This does not require much Excel skill to create as it’s just a formatted table. You can use some formulas to calculate the RPN’s although you could merely print the form and update it by hand depending on the scenario you’re faced with.
We’ve included plenty of screen-shots below so you can replicate. In the instructions below we’ve also included some FMEA content regarding failures around making coffee as an example so you can see what sort of information to enter into each column. Hope that helps!!
There are 3 main sections:
1/ The Header – this section captures top level info on the process being assessed
2/ The pre-mitigation FMEA – the FMEA itself which is a series of columns capturing the relevant data pertaining to the element of the FMEA. In this template, I’ve included some instructions for each column (formatted with a pale yellow background – you can omit this if you’re confident in what to enter).
3/ The Post mitigation FMEA – this section summarizes the risk score post any mitigation actions being deployed.
1/ The header
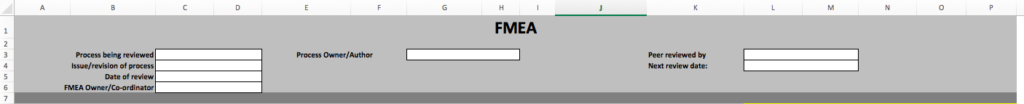
In this section you can see we capture a series of information this includes:
a) the process being reviewed
b) The issue/revision of the process
c) The date of the review
d) The coordinator of the FMEA process
e) The Owner of the process being reviewed (note this can be an individual or function)
f) The date the FMEA was peer-reviewed
g) the next FMEA review date
This section just uses merged cells, a formatted/colored background, and white cells to support data entry
The pre-mitigation FMEA
This section is a series of columns let’s look at each one individually and see what it does. We’ll illustrate this guide with the example of making a Cup of coffee.
1/ Step No
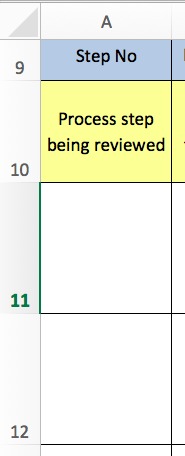
This is the process step
eg. fill coffee pot with water
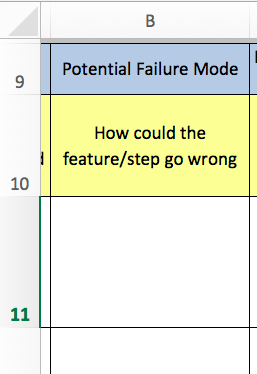
2/ Process Failure mode
This column captures what could go wrong with the process step
e.g. the wrong amount of water
3/ Potential Failure effect
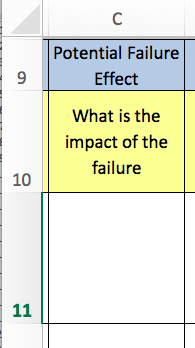
This column looks at the impact of the failure. This could be a knock on impact to the next step in the process or impact the customer or other.
e.g. coffee too weak
4/ Severity
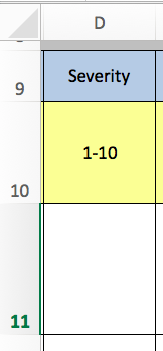
The severity of the failure is then graded 1-10 with 10 being the most severe
e.g. 8
5/Potential causes
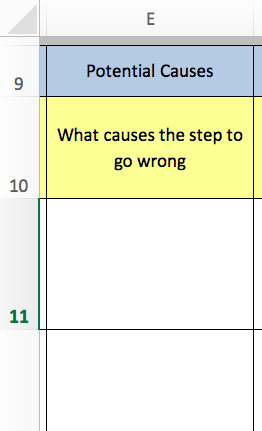
This column captures the cause of what could go wrong
e.g. no water level indicator on the coffee pot
6/ Occurrence
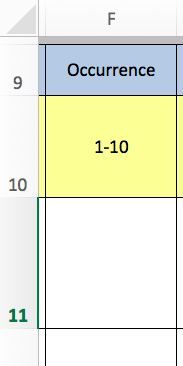
How frequently could this occur (1 – infrequently – 10 every time)
e.g. 10
7/ Controls
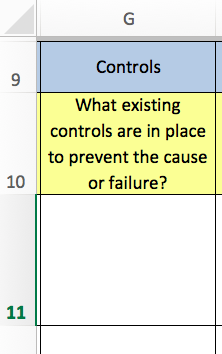
What controls are in place currently to mitigate the potential failure
e.g. Visual indicator on the coffee pot
8/ Detection
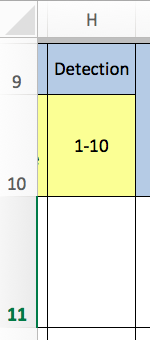
What is the detection rate given the controls (1- caught infrequently 10 caught every time)
e.g. 7
9/ RPN (Risk Priority Number)
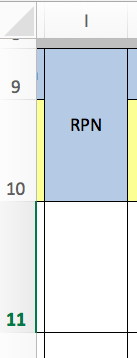
The RPN is calculated thus: Severity x Occurrence x Detection – it allows you to prioritize risks captured o the FMEA. As you’re creating the template in Excel you can have this as a formula or simply allow the user to enter it manually.
e.g. 8 x 10 x 7 = 560
The next set of columns deal with the risk mitigation and the effect on the RPN. These actions can be brainstormed or as a result of another process (i.e. Poke Yoke).
10/ Recommended actions
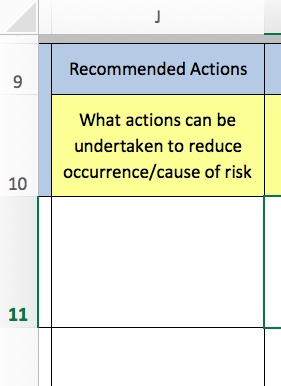
What actions can be undertaken to reduce the RPN (or risk), e.g. utilize appropriately sized jug to fill the coffee pot
11/ Action Owner
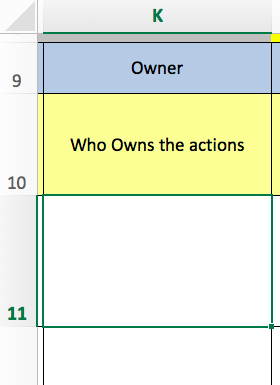
This captures the owner for the risk mitigation action i.e. Coffee maker/chef
Post-mitigation FMEA
Columns 12-16 are all about the RPN score post risk mitigation. This looks at the actions taken and creates a new RPN (risk score) based on the results post-implementation. If successful the RPN should be reduced!
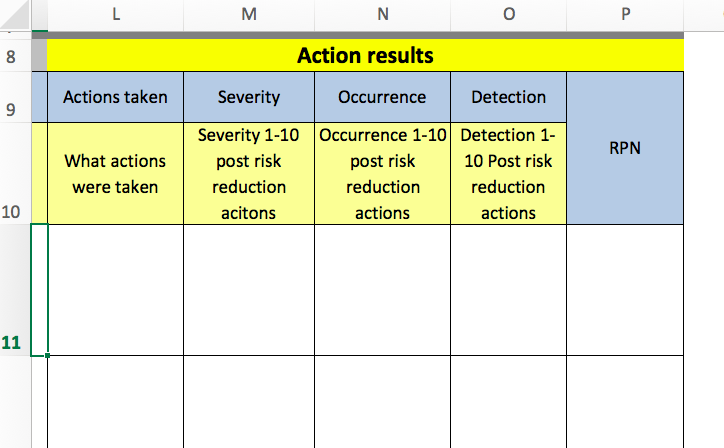
12/ Actions taken
This column records the “actual” actions taken – note these may differ from the proposed actions.
e.g. 1-litre measuring jug used to fill the coffee pot
13/ Severity
The severity of the failure post risk mitigation
e.g. 8
14/Occurrence
The likelihood of occurrence post risk mitigation
e.g. 3
15/ Detection
The rate of detection post risk reduction activity
e.g. 6
16/ RPN
This is the RPN post risk mitigation actions based on Severity x Occurrence x Detection. You can use a formula here to calculate it
e.g. 8x3x6=144 or allow the user to enter it manually.
So there is our guide on creating a FMEA template in Excel – hope you found this useful. As always we love to hear your comments in the feedback section below? And don’t forget to check out our great Problem Solving Guide you can check out for further problem solving tools, techniques and templates.